Mitigating the Urban Heat Island Effect as an example of regulating ecosystem services
This article presents a proposed method for assessing and mapping the cooling effect of urban heat islands in the Lubuskie Voivodeship. The analysis focuses on Zielona Góra and Gorzów Wielkopolski, their Functional Urban Areas (FUAs) and landscape units used as the basic aggregation layer for assessing ecosystem services.
1. An urban heat island
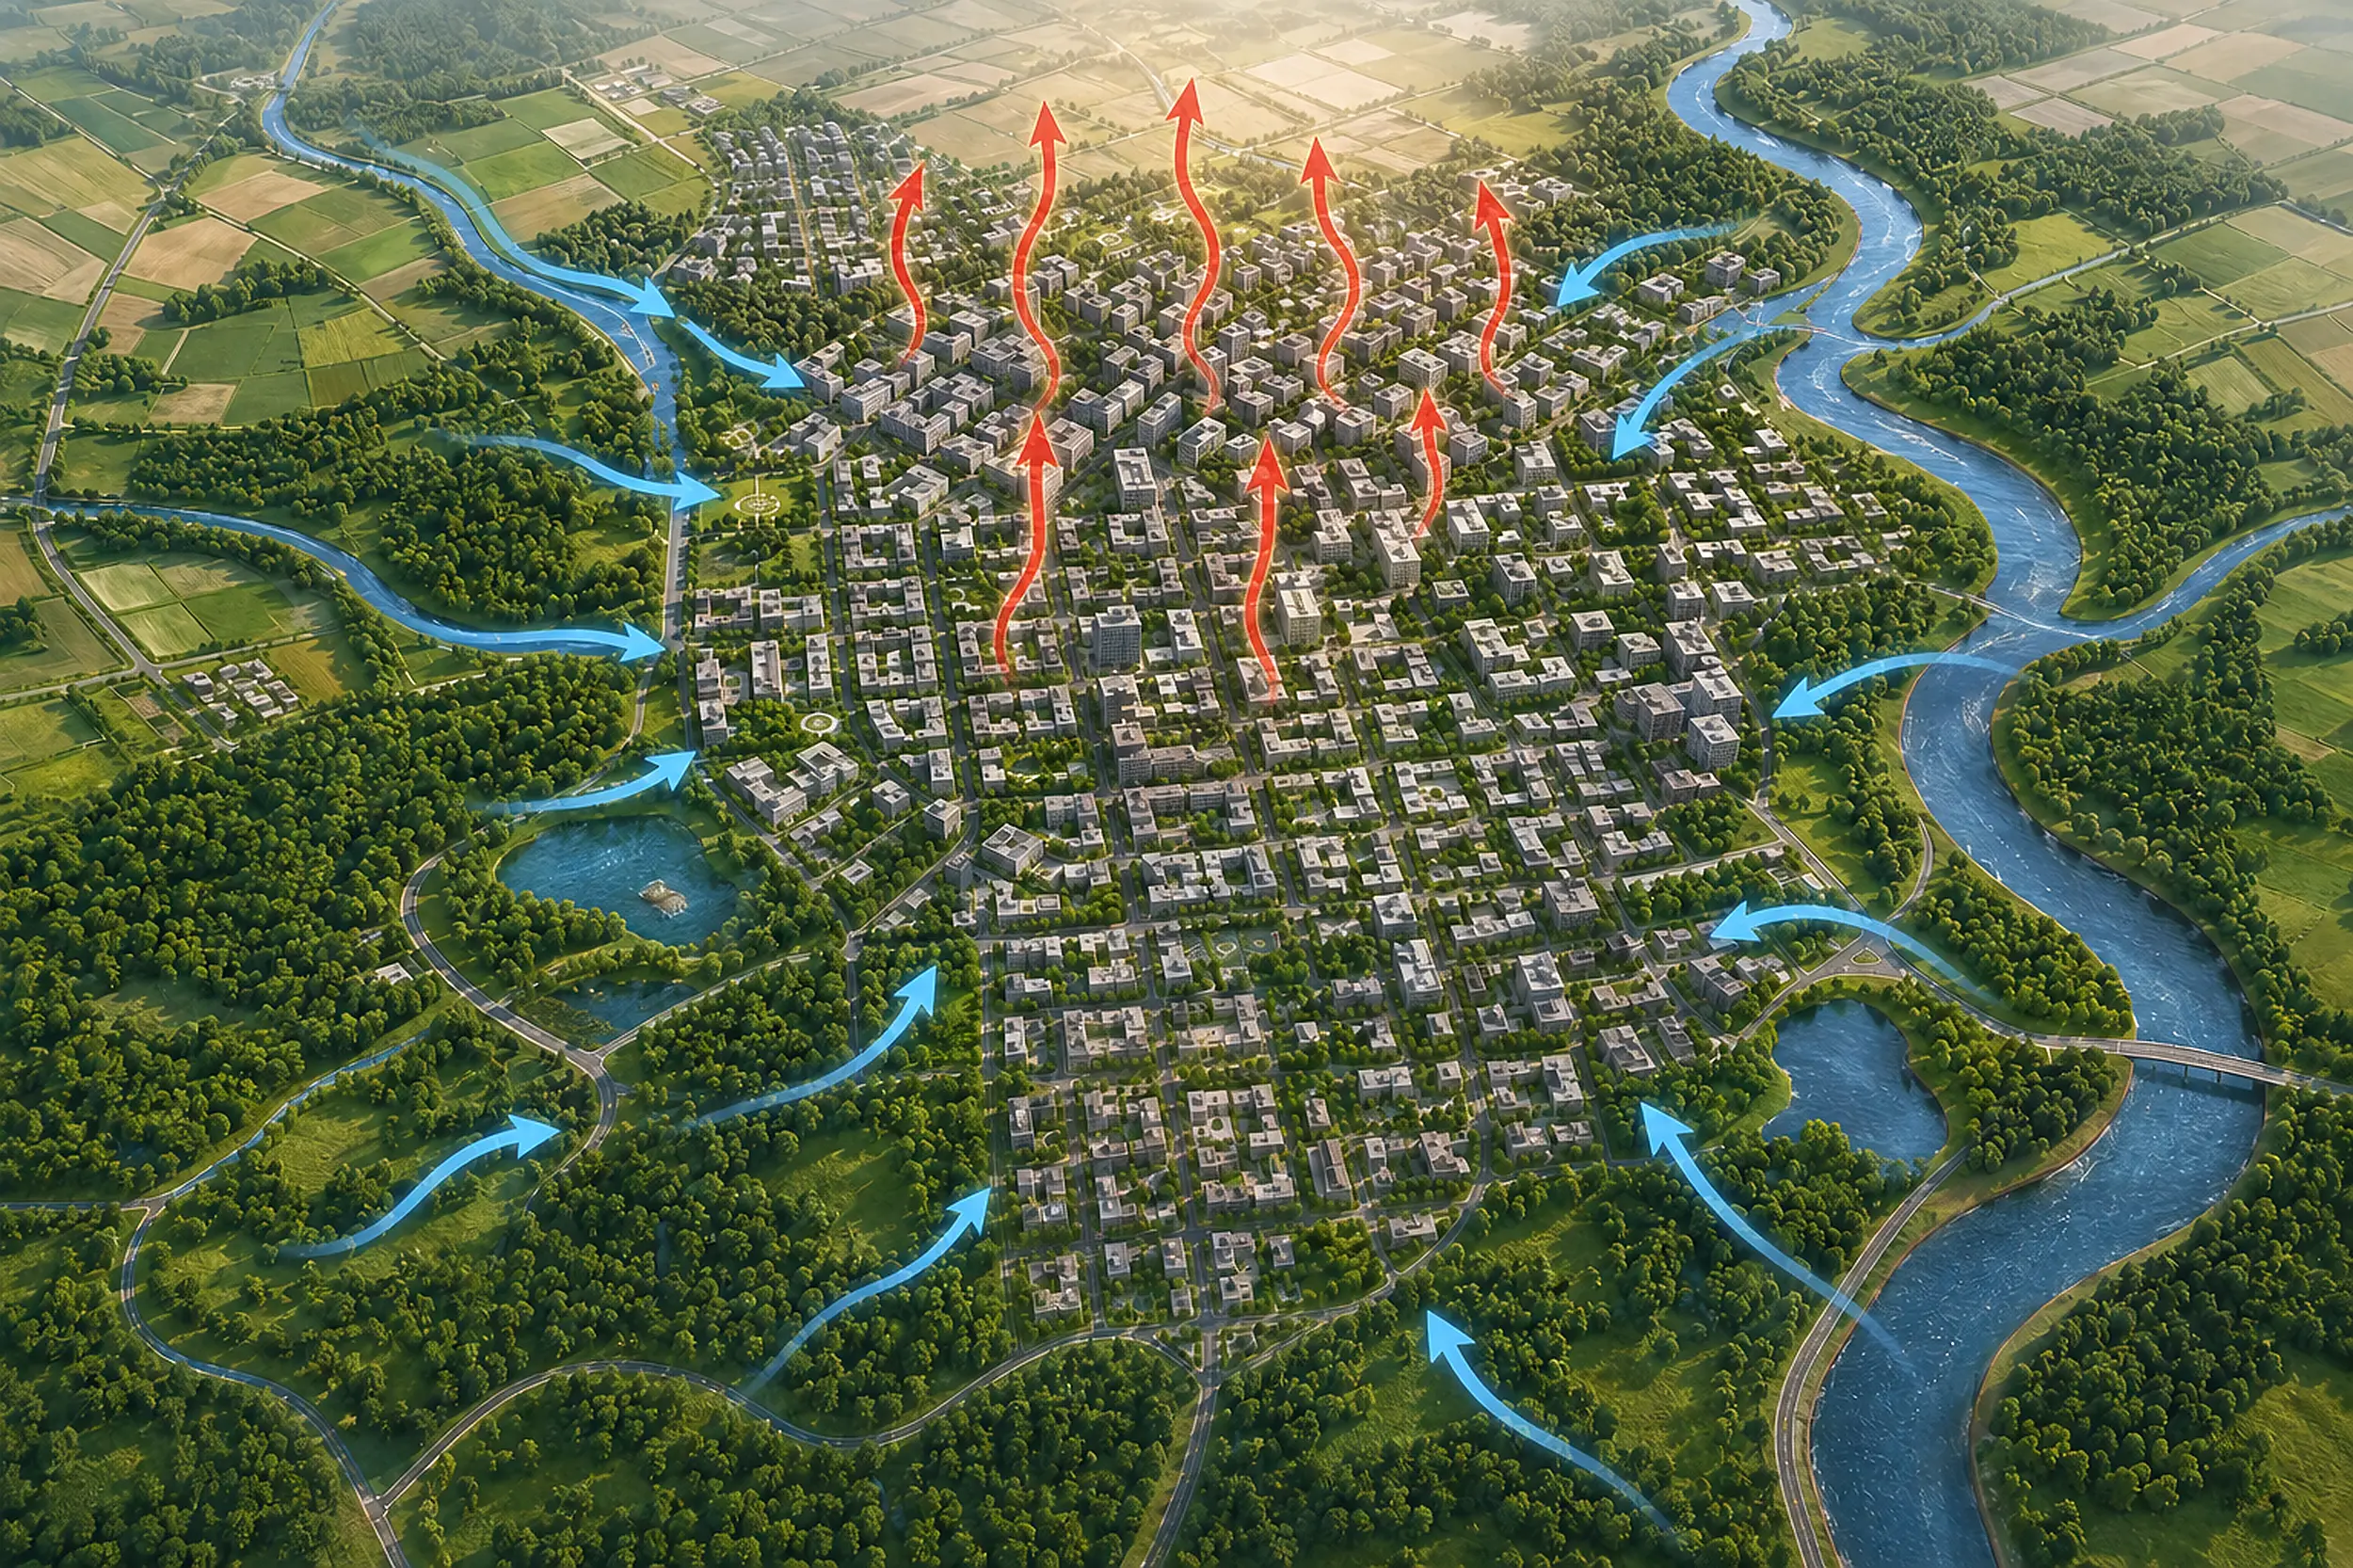
Urban heat islands are among the most visible climatic effects of urbanisation. They arise where natural or semi-natural surfaces are replaced by dense development and impervious materials, which store heat, limit evapotranspiration and alter the local surface energy balance (Oke, 1982; Voogt & Oke, 2003). The urban heat island phenomenon occurs when cities, characterised by heat-absorbing concrete and asphalt, become significantly warmer than the surrounding rural areas. To counteract this, urban planners utilise ‘air corridors’ or ‘ventilation paths’ – such as green belts, parks or specially designed street layouts – to allow cooler air from the suburbs to flow into densely built-up areas. Structural planning is key: varying building heights and orienting streets in line with prevailing wind directions (in accordance with the principles of urban roughness) help to dissipate heat. It is also important to use cooling materials – i.e. those that reflect light – on roofs and roads, which reduces the overall amount of heat retained, thereby increasing the effectiveness of ventilation.
Studies conducted in Polish cities, including Łódź, Warsaw, Kraków and Poznań, show that the intensity and spatial distribution of urban heat islands depend on land use, building density, atmospheric circulation, topography, vegetation structure and the wider landscape context (Kłysik & Fortuniak, 1999; Bokwa et al., 2015; Kuchcik et al., 2014; Półrolniczak et al., 2017). Land Surface Temperature (LST) derived from satellite data, particularly Landsat thermal imagery, enables the assessment of the Surface Urban Heat Island (SUHI) in relation to vegetation cover, impervious surfaces and functional land-use types (Weng et al., 2004; Majkowska et al., 2017; Renc et al., 2022). Green spaces, bare soil and blue-green infrastructure mitigate overheating primarily through shading, evapotranspiration and the cooling properties of water and vegetation (Bowler et al., 2010; Kumar et al., 2024).
In this context, the analysis for the Lubuskie Voivodeship, covering Zielona Góra, Gorzów Wielkopolski and their functional urban areas, provides a spatial basis for identifying where the potential for natural cooling is greatest and where adaptation measures should be prioritised.
2. Urban heat island cooling as an ecosystem service
Urban heat island cooling refers to the ability of natural and semi-natural elements of the urban and suburban landscape to reduce excessive surface and air temperatures. This effect is mainly produced by vegetation, shaded surfaces, evapotranspiration, soil moisture, blue infrastructure and the continuity of ventilation corridors. It is therefore a regulatory ecosystem service of direct importance for climate change adaptation, public health and quality of life in cities vulnerable to heatwaves.
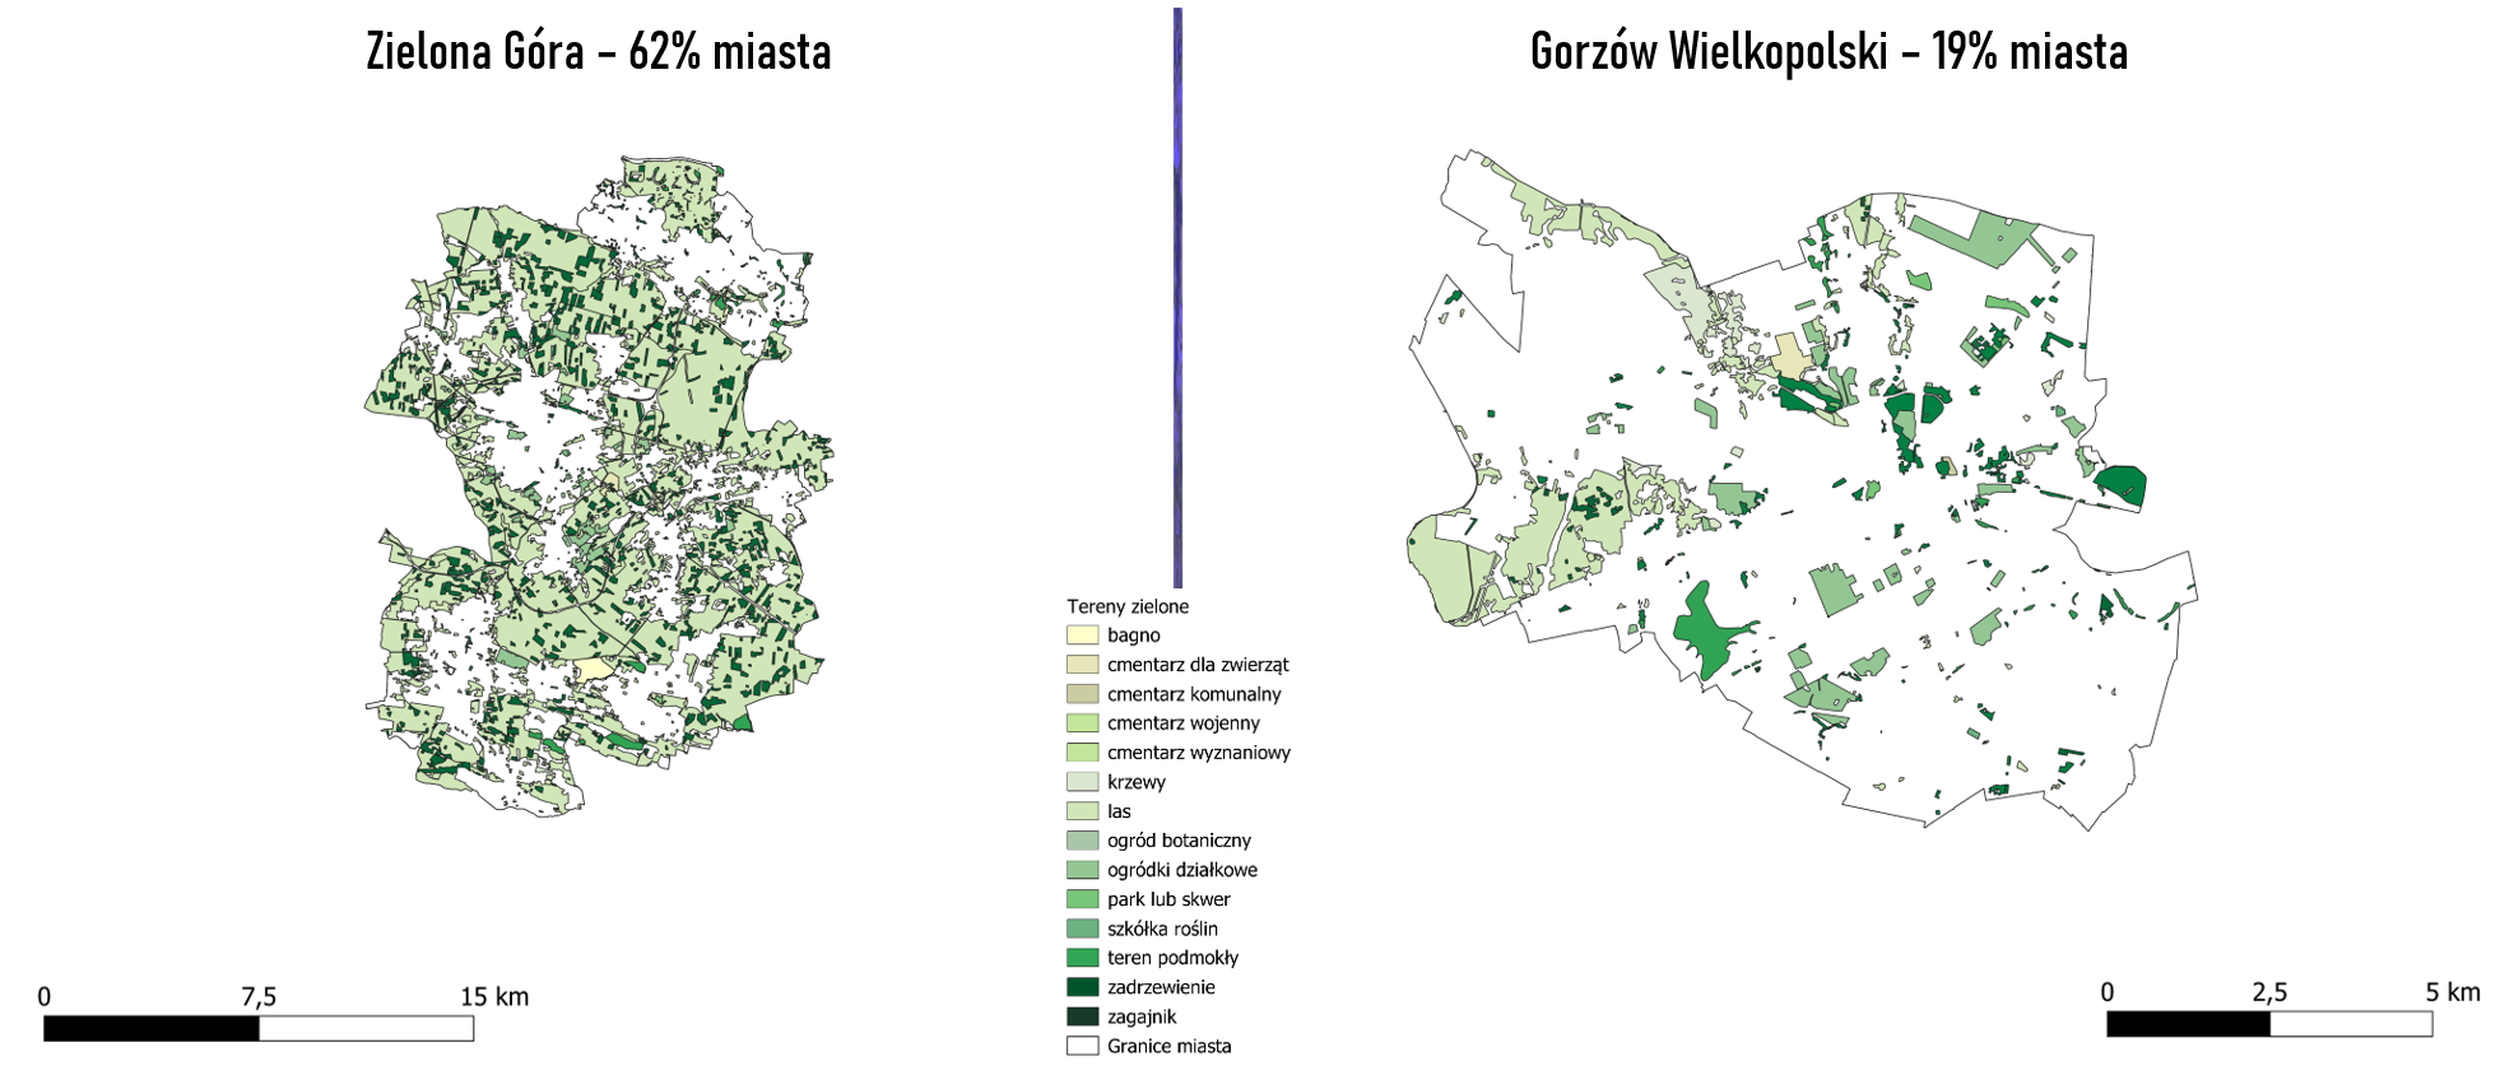
In the Lubuskie Province, cooling services are of particular importance for two regional urban areas: Zielona Góra and Gorzów Wielkopolski. The two cities have different landscape structures. Zielona Góra is characterised by a high proportion of green spaces, whilst Gorzów Wielkopolski has a higher proportion of impervious surfaces. This contrast makes both FUA useful examples for interpreting how landscape structure influences the intensity and spatial persistence of urban heat islands.
3. Spatial reference system: landscape units and FUA
The assessment uses two complementary spatial reference levels. The first level comprises landscape units defined in the regional landscape audit. These units provide a coherent framework for interpreting the impact of land cover, land use and landscape structure on the cooling effect. This is significant because the cooling effect stems mainly from the physical structure of the landscape, rather than solely from administrative boundaries.
The second level is the FUA. In the SUHI framework, the FUA represents the wider urban-rural system surrounding each major city and serves as a reference background for calculating temperature differences. The results at the FUA level show how the cooling effect is distributed across the wider functional area and how suburban forests, agricultural landscapes, water bodies and open spaces mitigate overheating in the city centre.
4. Methodological framework, satellite data and spatial data
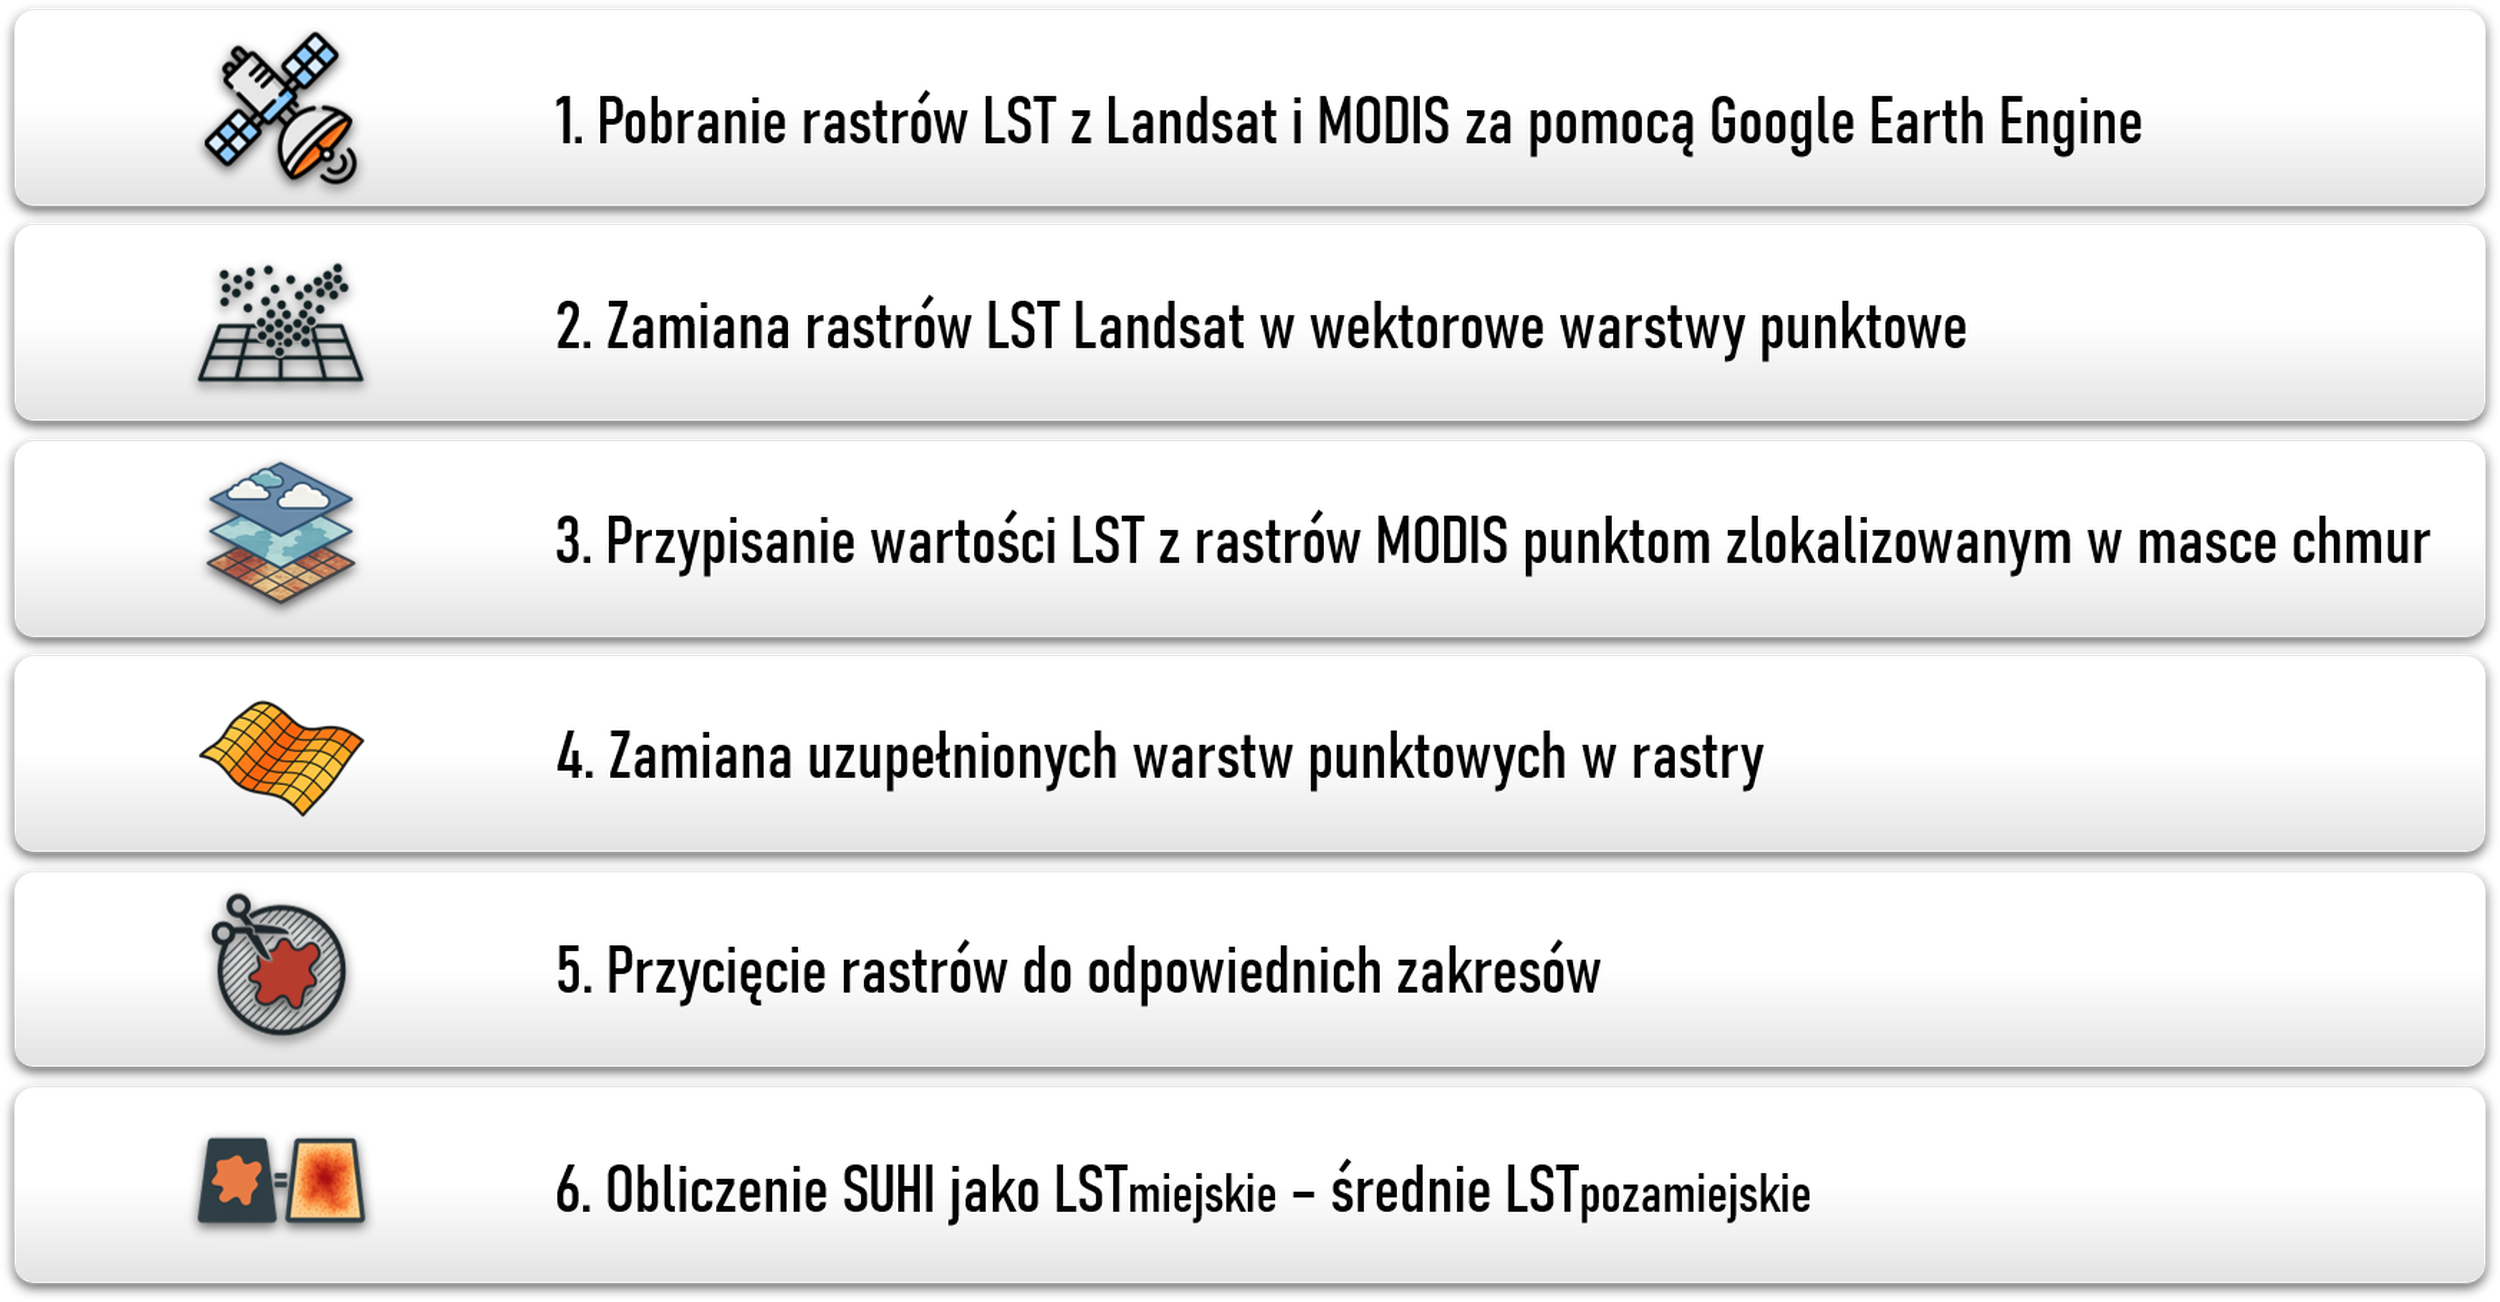
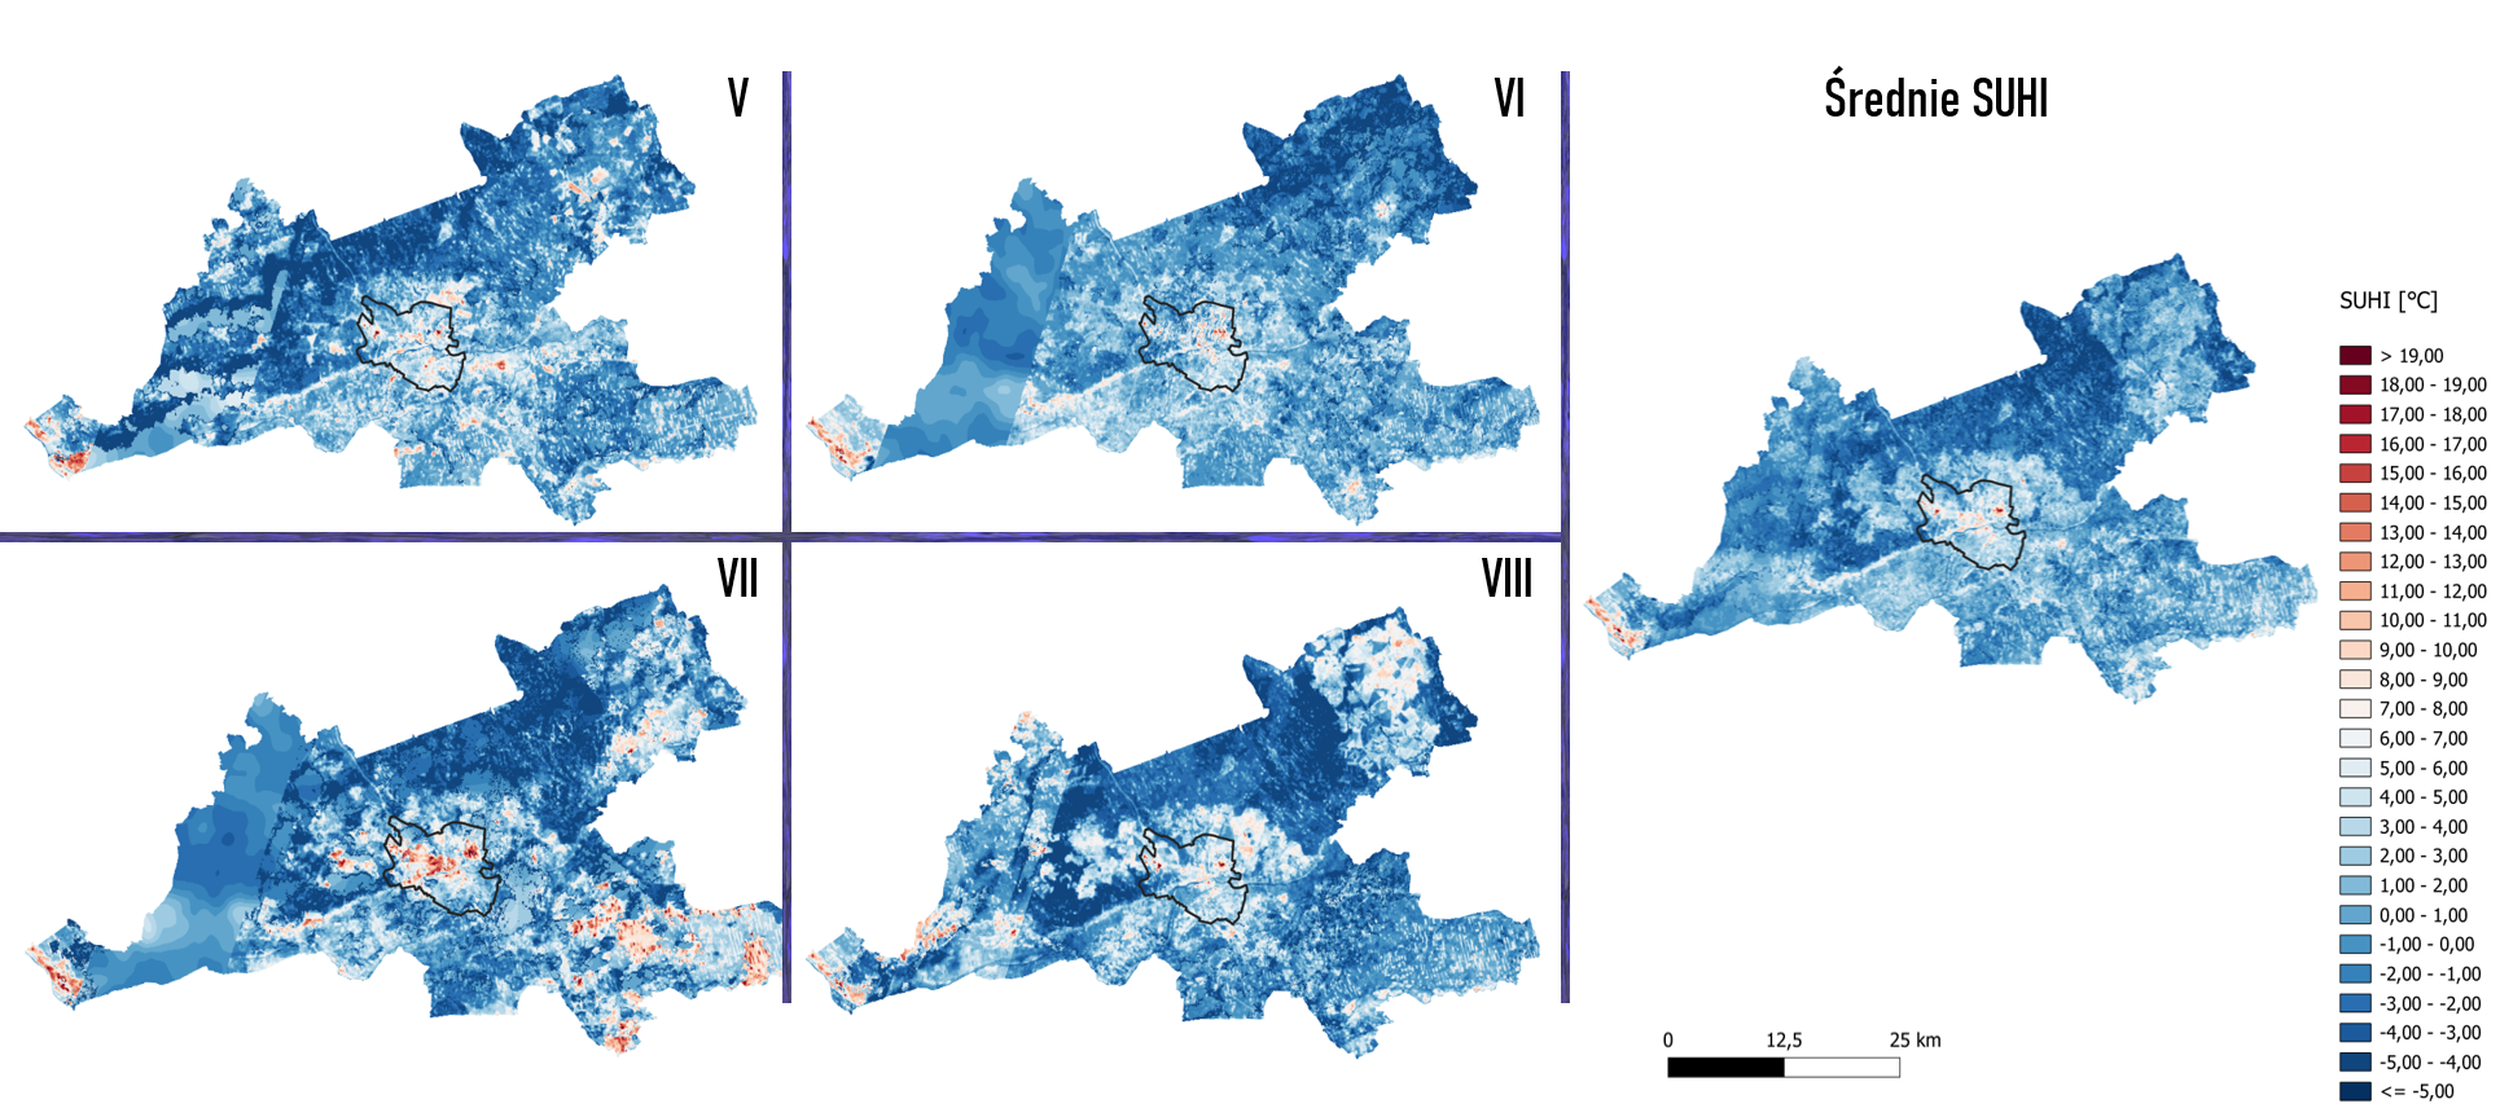
The methodology combines LST data obtained from satellites with vector spatial data and statistics on landscape units. The LST data were primarily derived from Landsat 8 images, as their spatial resolution is suitable for detecting thermal contrasts within urban areas. MODIS data were used as a supplementary source to fill gaps in the Landsat images where cloud cover resulted in NoData values. Google Earth Engine supported the automatic acquisition and pre-processing of data, whilst QGIS was used for spatial modelling, the integration of raster and vector data, and the final SUHI calculations.
| Data set | Source or layer | Role in the analysis |
| LST data | Landsat 8; MODIS | Determining the LST, filling in data gaps and establishing the thermal conditions for calculating the SUHI index. |
| Administrative masks and FUA | BDOT10k / boundaries from the Geoportal | The designation of urban areas and larger urban functional reference areas. |
| Water bodies and wetlands | PTWP, OIMK, SWRS, SWKN from BDOT10k | Elimination of the cooling effect of water in the SUHI 2 quality control variant. |
| Landscape units | Regional landscape audit | Aggregation of the SUHI index and explanatory variables into units relevant to planning. |
| Land cover structure | Green spaces and impervious surfaces | An analysis of cooling and overheating mechanisms at city and FUA level |
Table 1. Input data used in the process
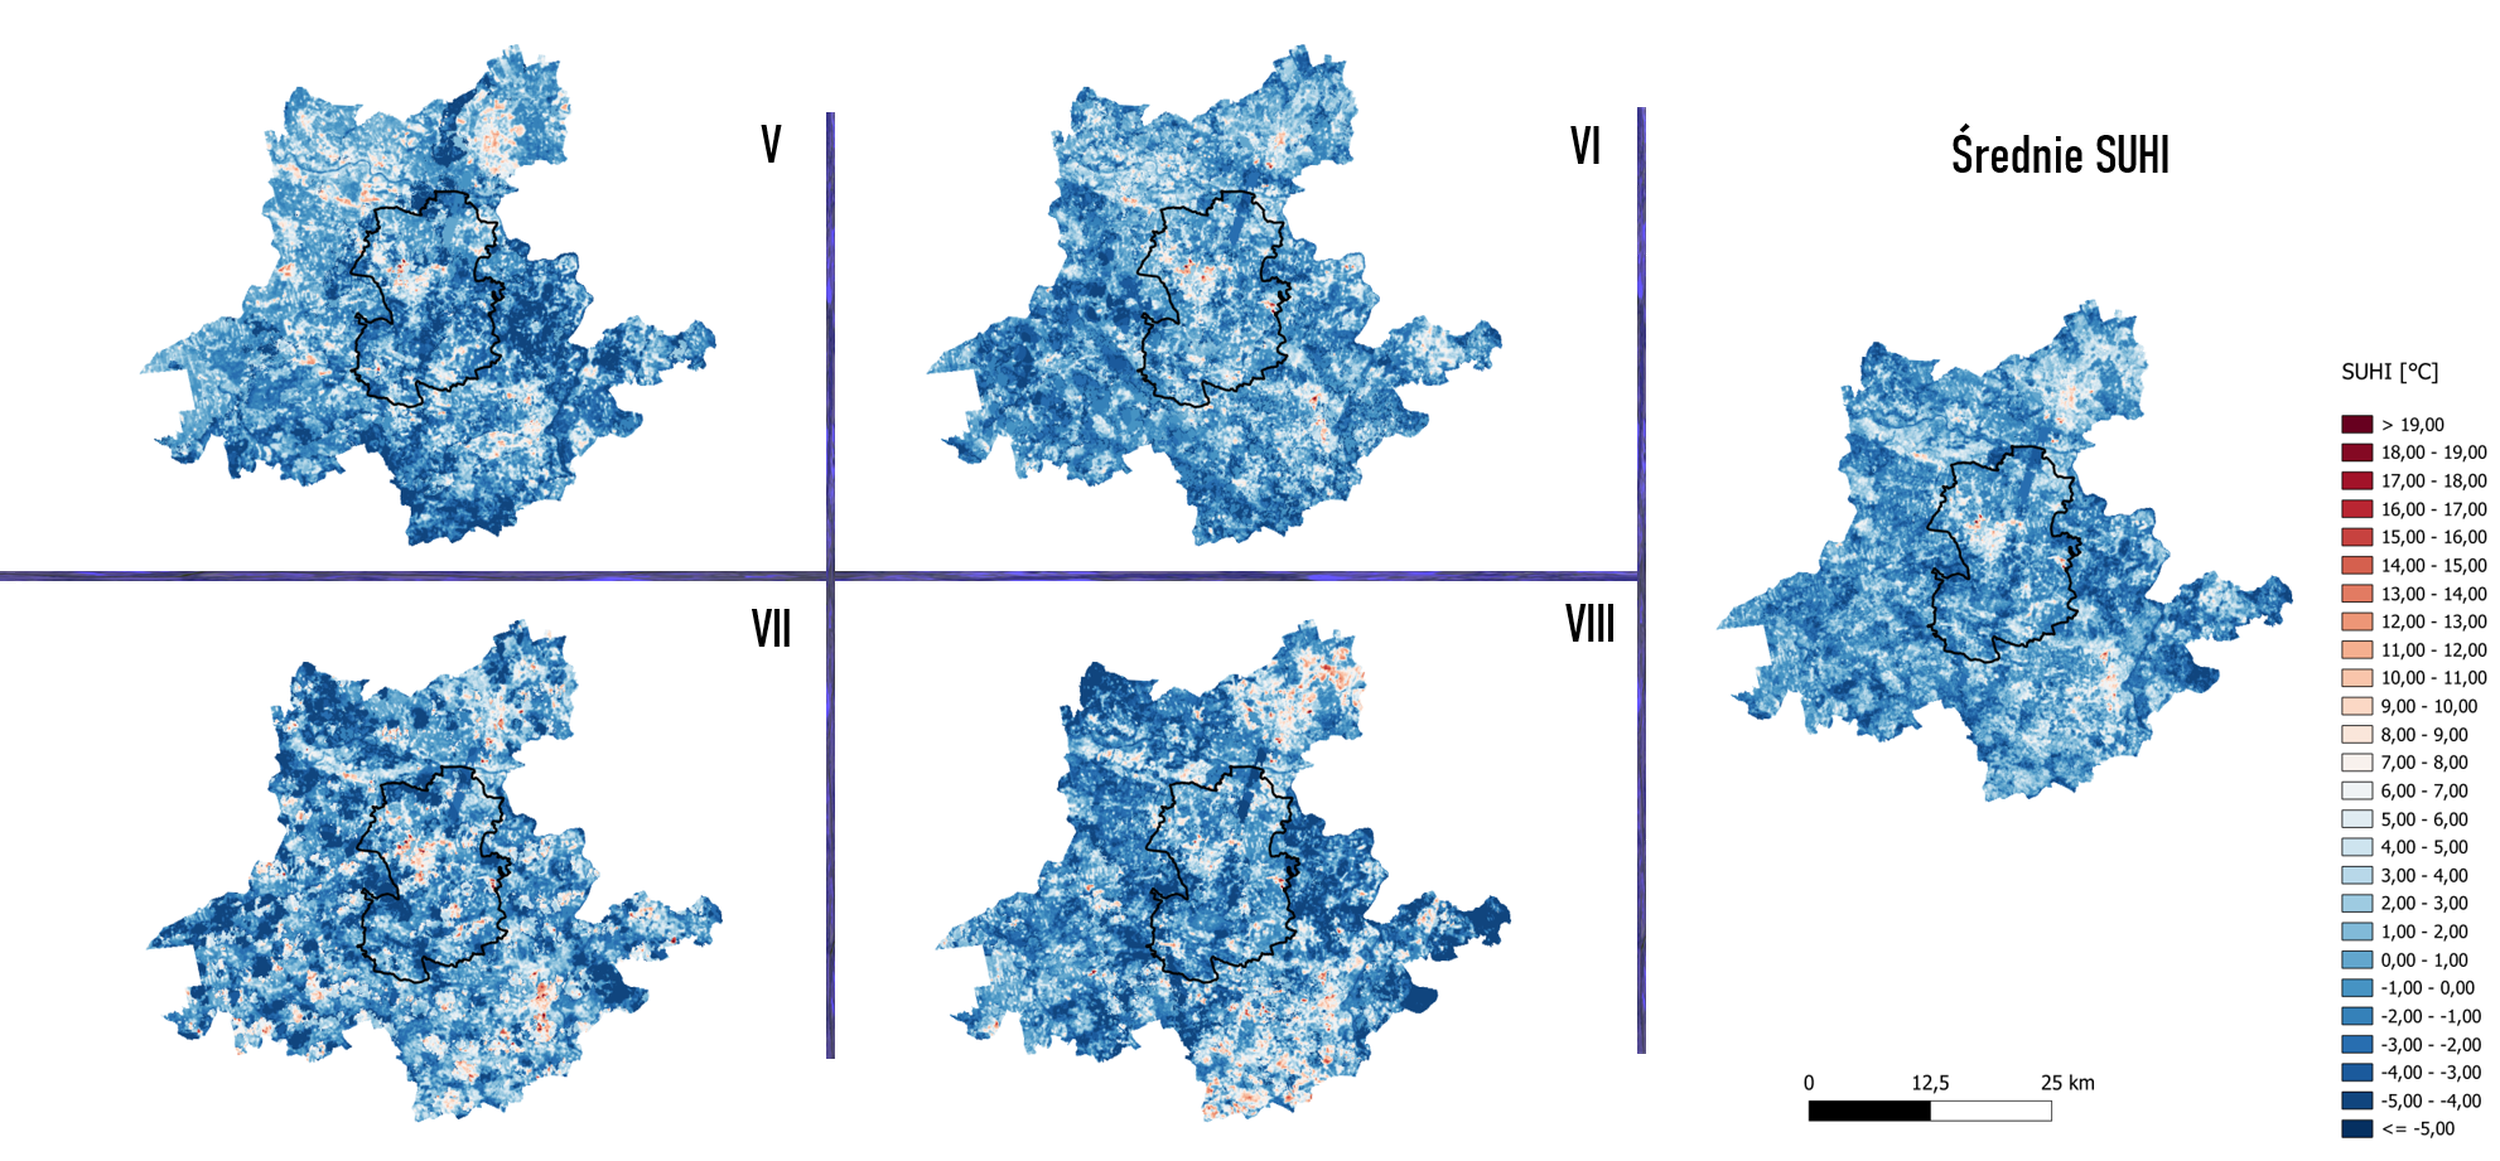
Two variants of the SUHI index were considered. SUHI 1 is the main index and represents the difference between the surface temperature in the city and the average surface temperature of the surrounding FUA / non-urban reference area. SUHI 2 is a repeat of the calculations after excluding surface waters, wetlands and rivers with buffers from the analysis. The aim of SUHI 2 is to check whether the natural cooling effect of blue infrastructure distorts the assessment of the built environment. The comparison revealed only minor differences, so SUHI 1 can be treated as the main representative reference indicator.
5. Results for Zielona Góra and its FUA
Zielona Góra has significant natural cooling potential. Green spaces account for over 60 per cent of the city’s area, whilst impervious surfaces make up around 7 per cent. This distribution significantly reduces the average SUHI index and explains why the cooling effect is more noticeable here than in Gorzów Wielkopolski. Nevertheless, the city still experiences distinct hotspots of overheating associated with dense residential development, industrial and warehouse areas, a compact urban layout, and other highly impervious surfaces.
On the FUA scale, the larger urban-rural area surrounding Zielona Góra acts as a cooling background. Forested areas, agricultural landscapes and lakes form a regional thermal buffer, whilst selected urbanised or industrial landscape units remain warmer. The FUA result is significant because it shows that the cooling effect is not limited to the city’s administrative boundaries. It depends on the continuity of green and blue infrastructure across the entire functional region.
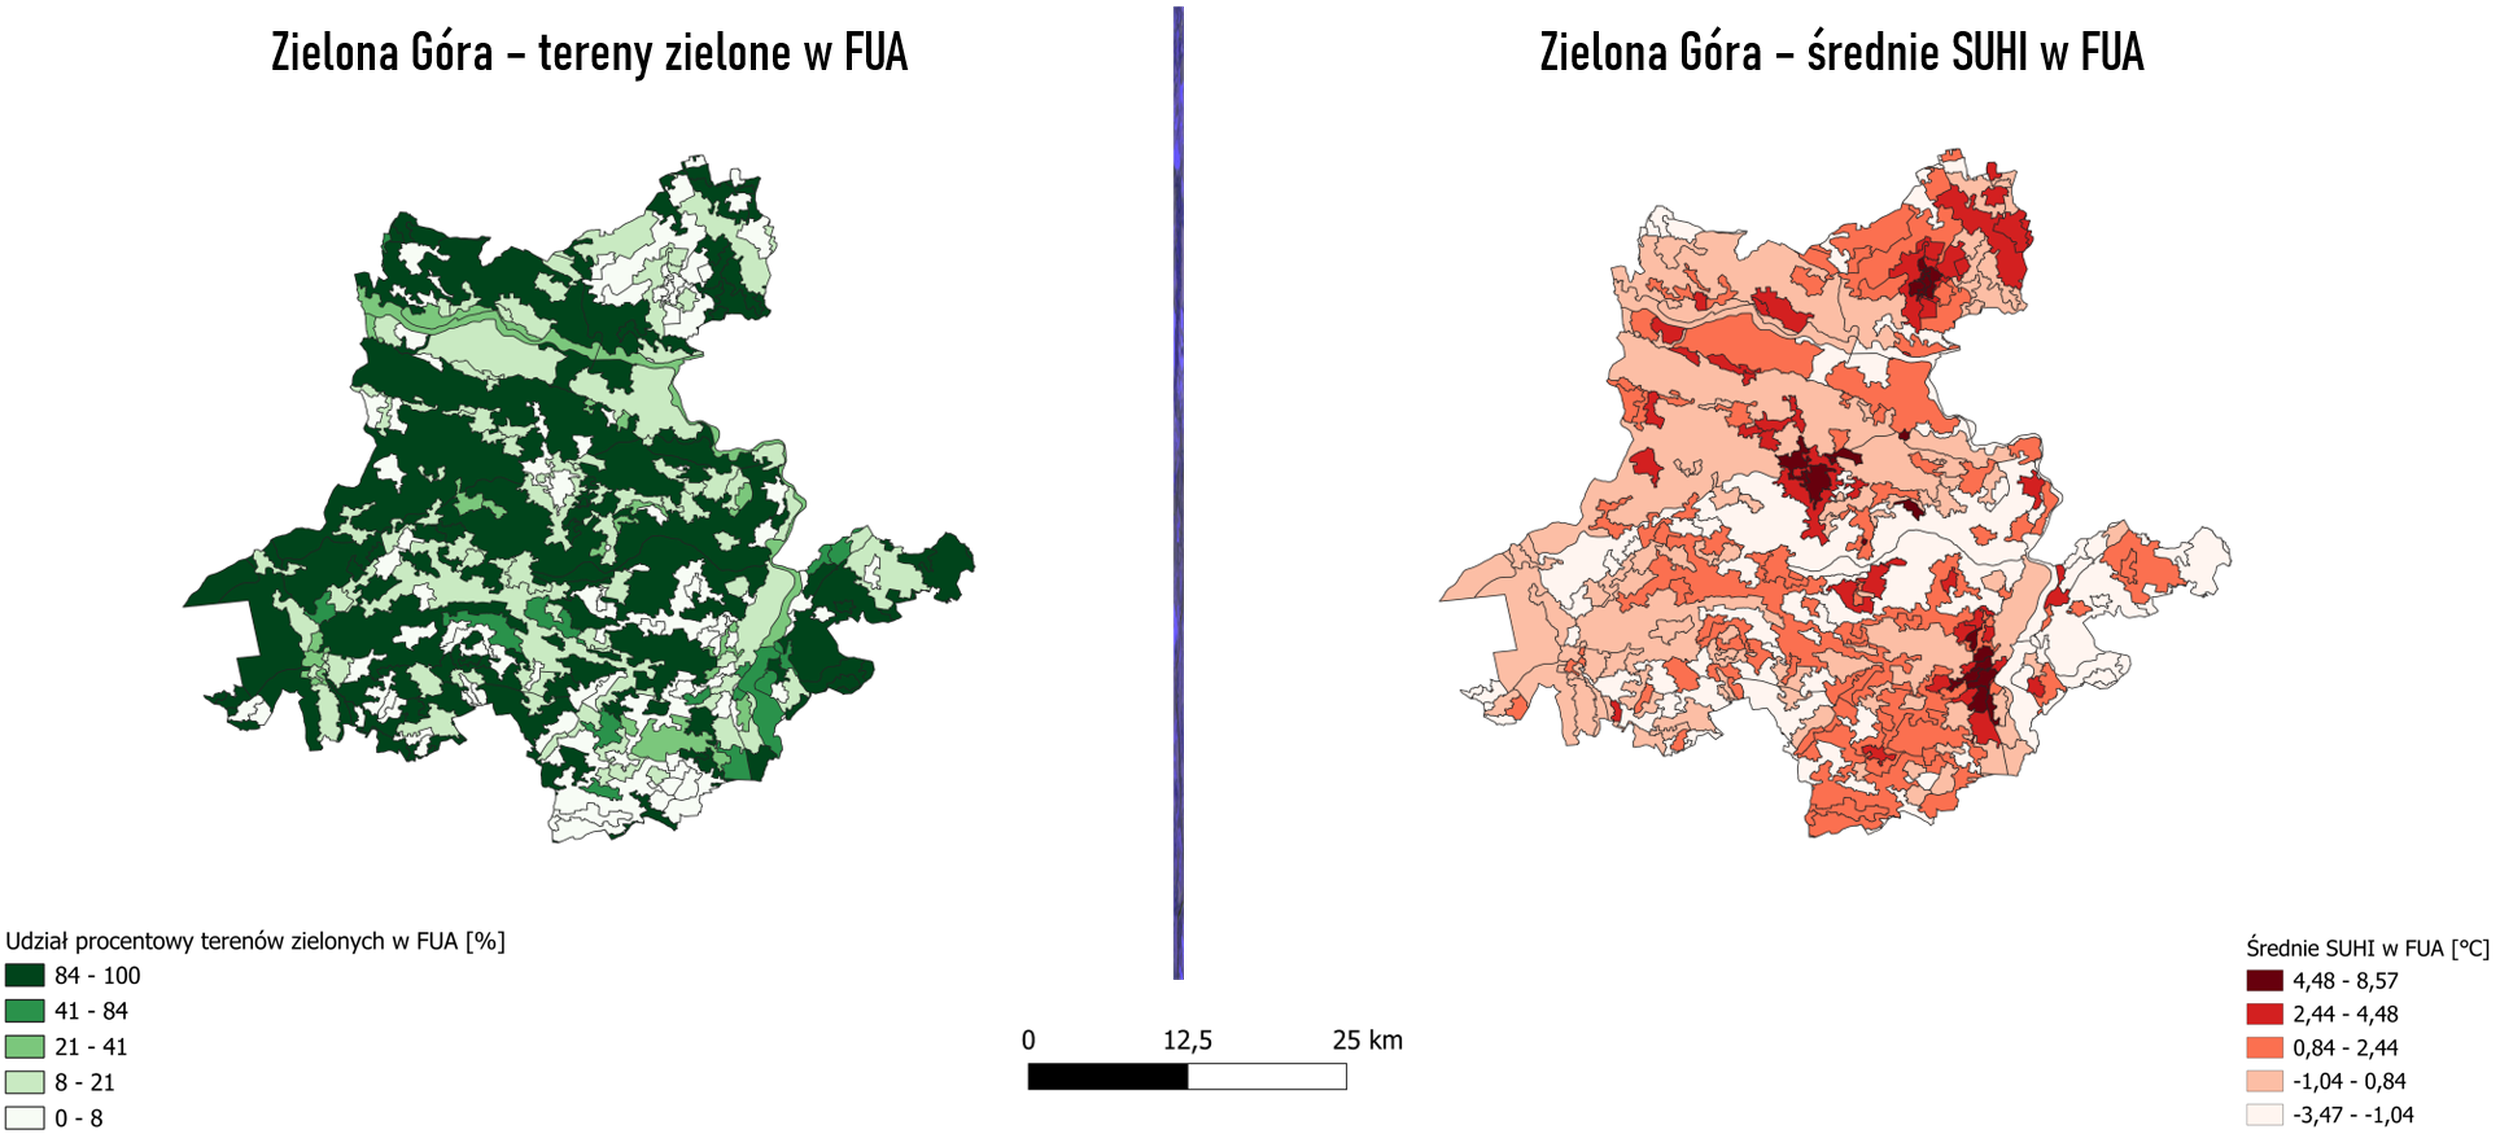
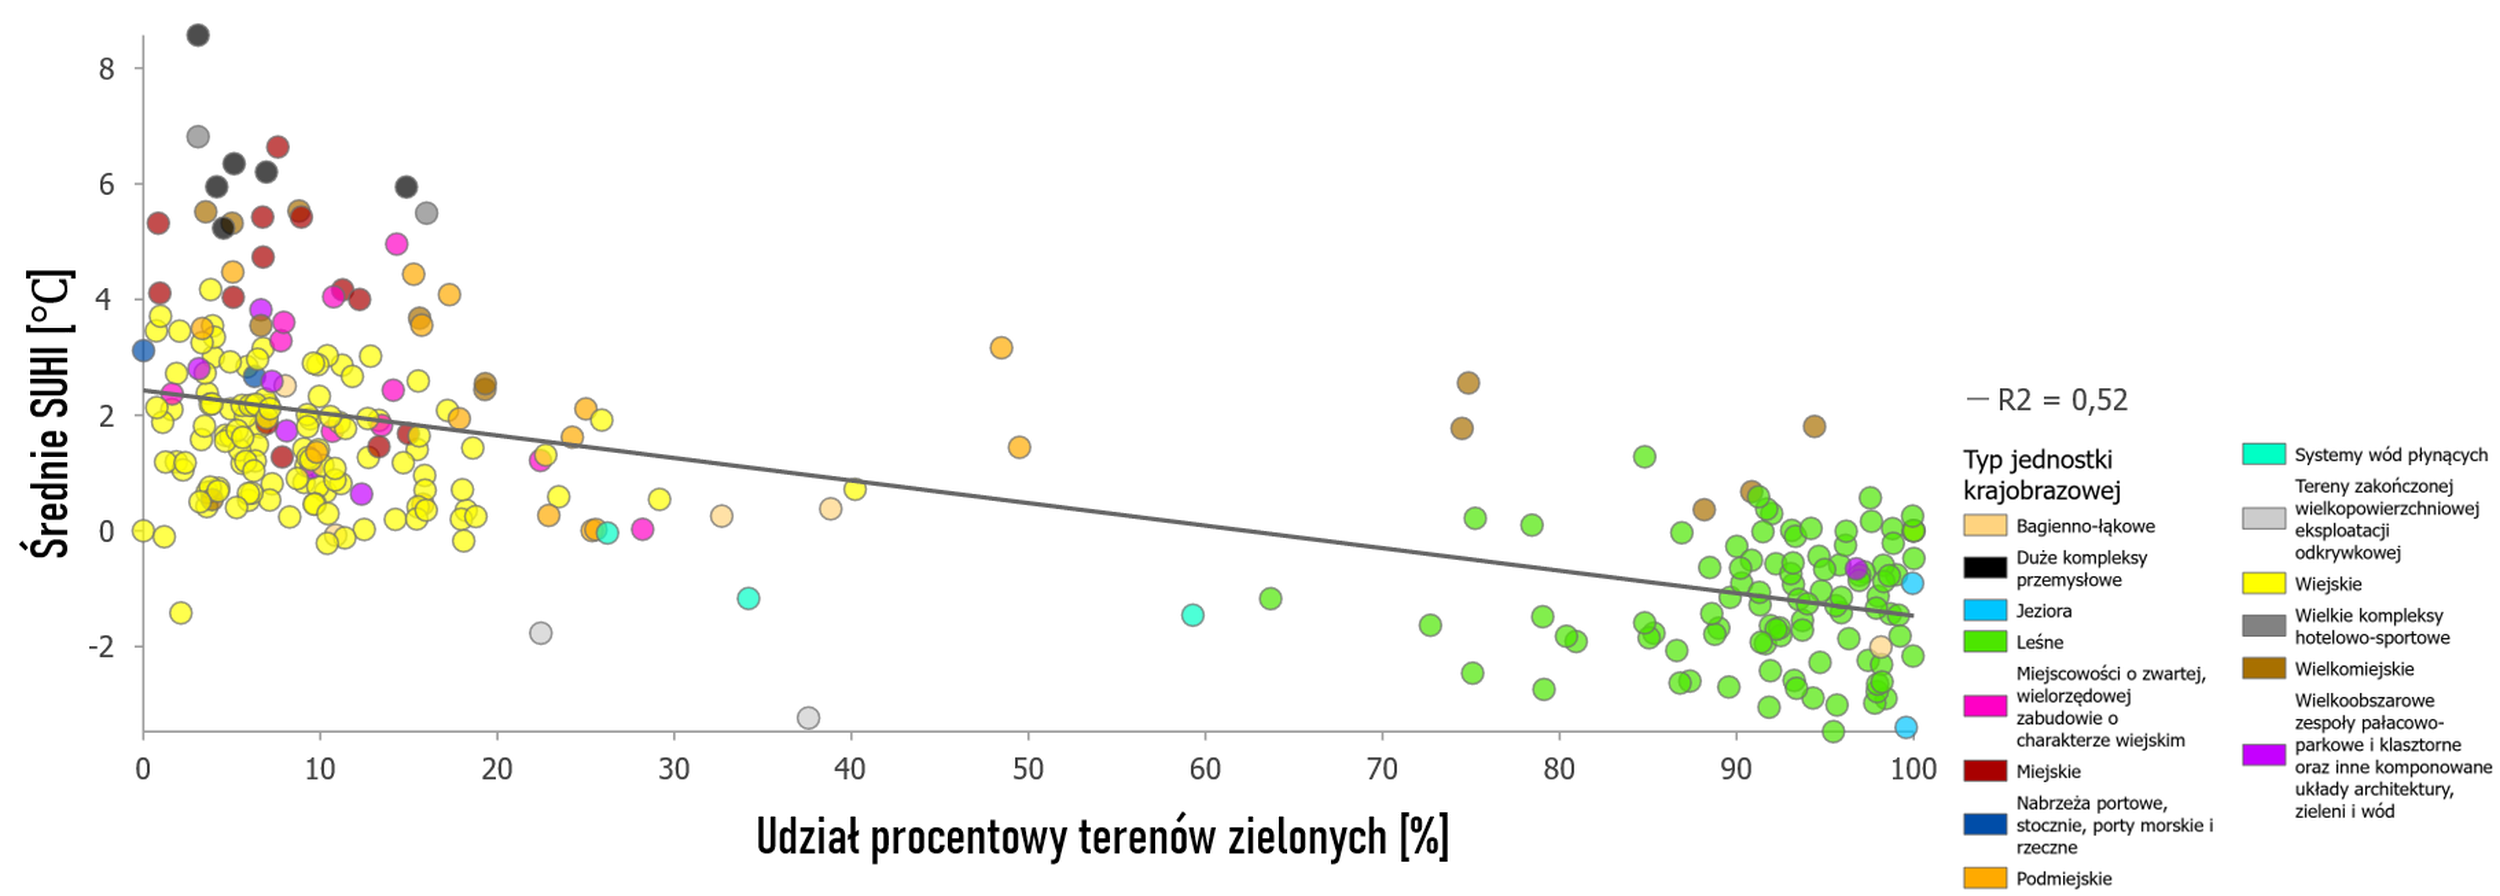
The relationship between the average SUHI value and green spaces is clearly negative both within the city itself and in the Zielona Góra FUA. Landscape units with a high proportion of forests, agricultural land and other green spaces generally exhibit lower SUHI values. The highest average SUHI values occur in large industrial complexes, hotel and sports complexes, and urban settlements with a preserved historical layout. This confirms that the proportion and continuity of vegetation are crucial for mitigating the effects of heatwaves.
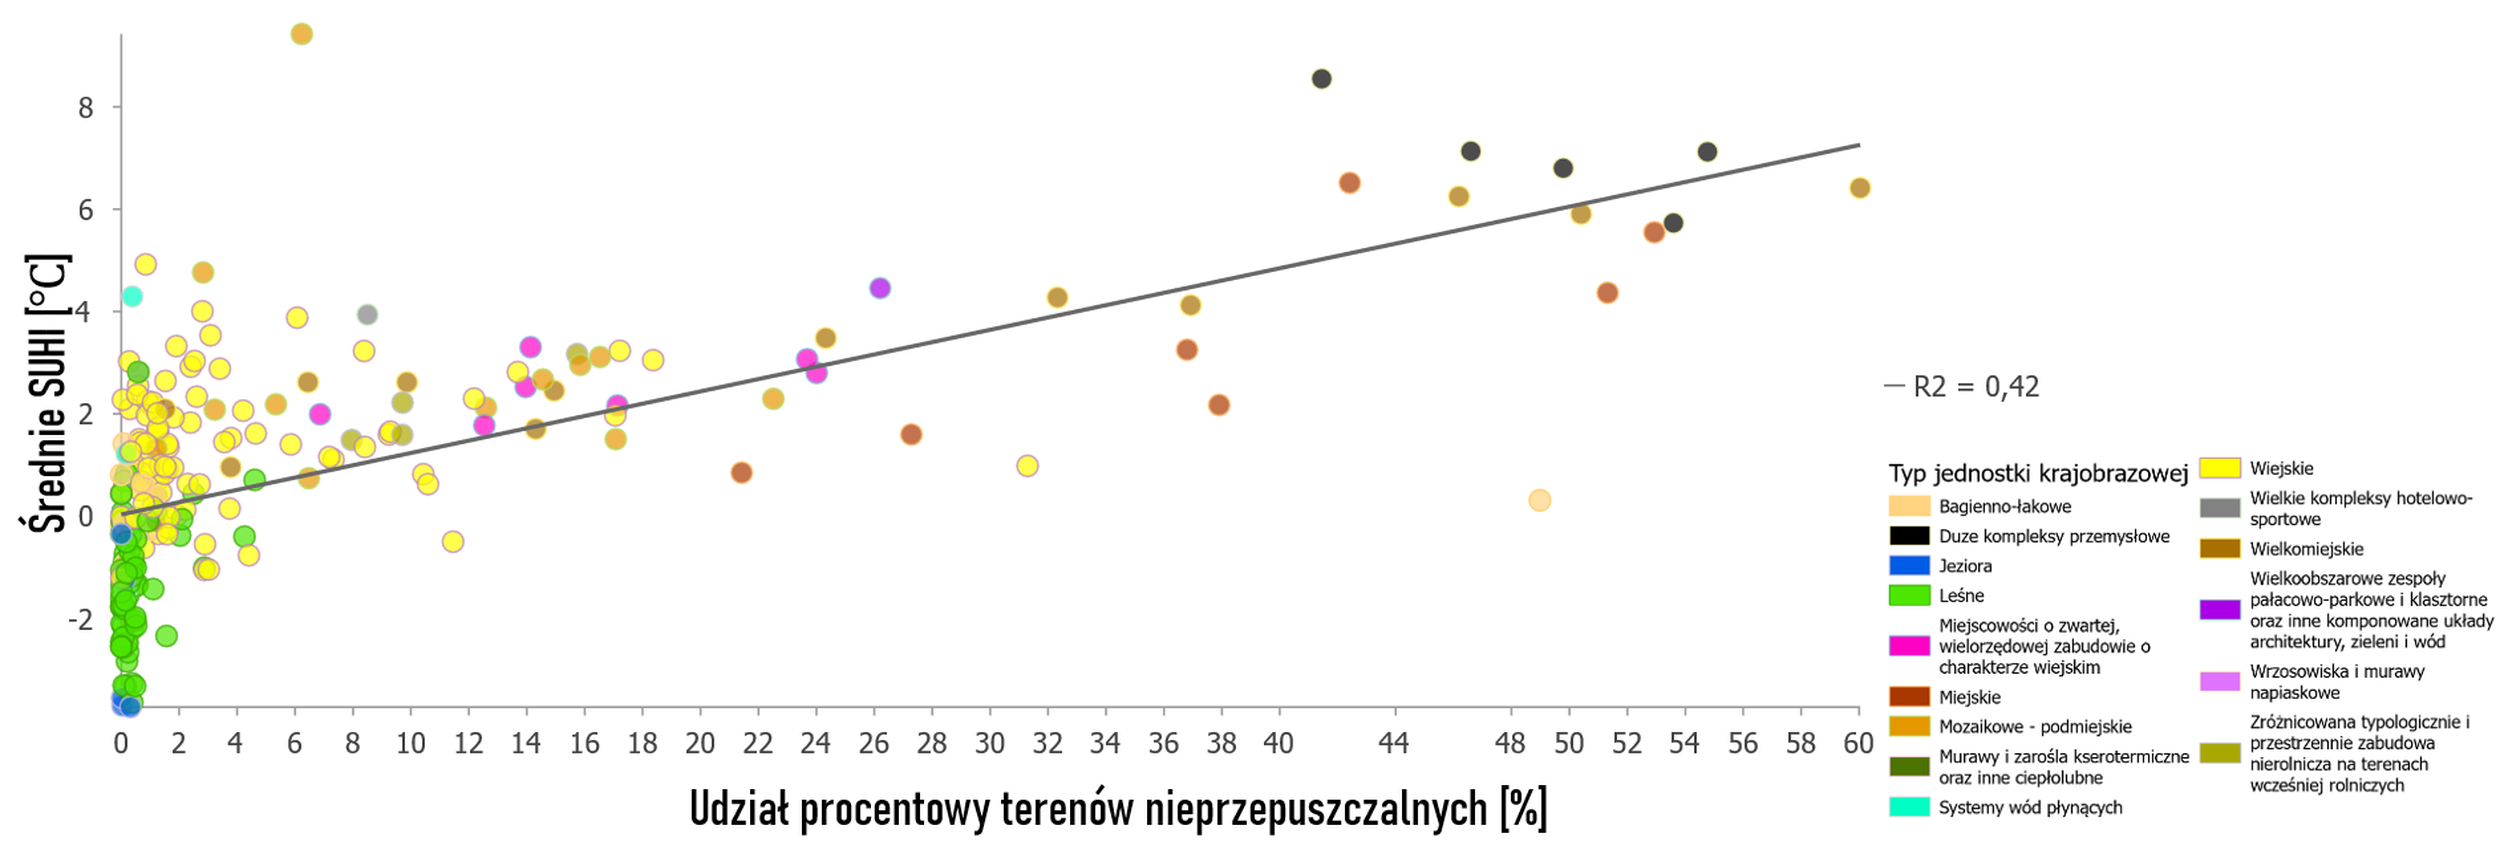
Impermeable surfaces show an inverse relationship. In the Zielona Góra FUA, landscape units with a higher proportion of sealed surfaces generally record higher average SUHI values. This relationship allows for the identification of areas where adaptation measures should focus on reducing soil sealing, introducing tree cover, improving soil permeability and protecting existing cooling corridors.
6. Results for Gorzów Wielkopolski and its FUA
Gorzów Wielkopolski is characterised by a distinct thermal and landscape pattern. Green spaces account for just under 20 per cent of the city’s area, whilst impervious surfaces account for around 18 per cent. Consequently, the city is more vulnerable to the intensification of the SUHI phenomenon, particularly in industrial areas, large production and storage zones, densely populated residential districts and the densely built-up historic parts of the city.
At the FUA level, the surrounding landscape partially mitigates overheating, although the cooling effect is less pronounced than in Zielona Góra. The negative correlation between green spaces and the SUHI index is weaker. This may be due to the scattered location of green spaces, their lower continuity, and the stronger influence of sealed urban and industrial surfaces.
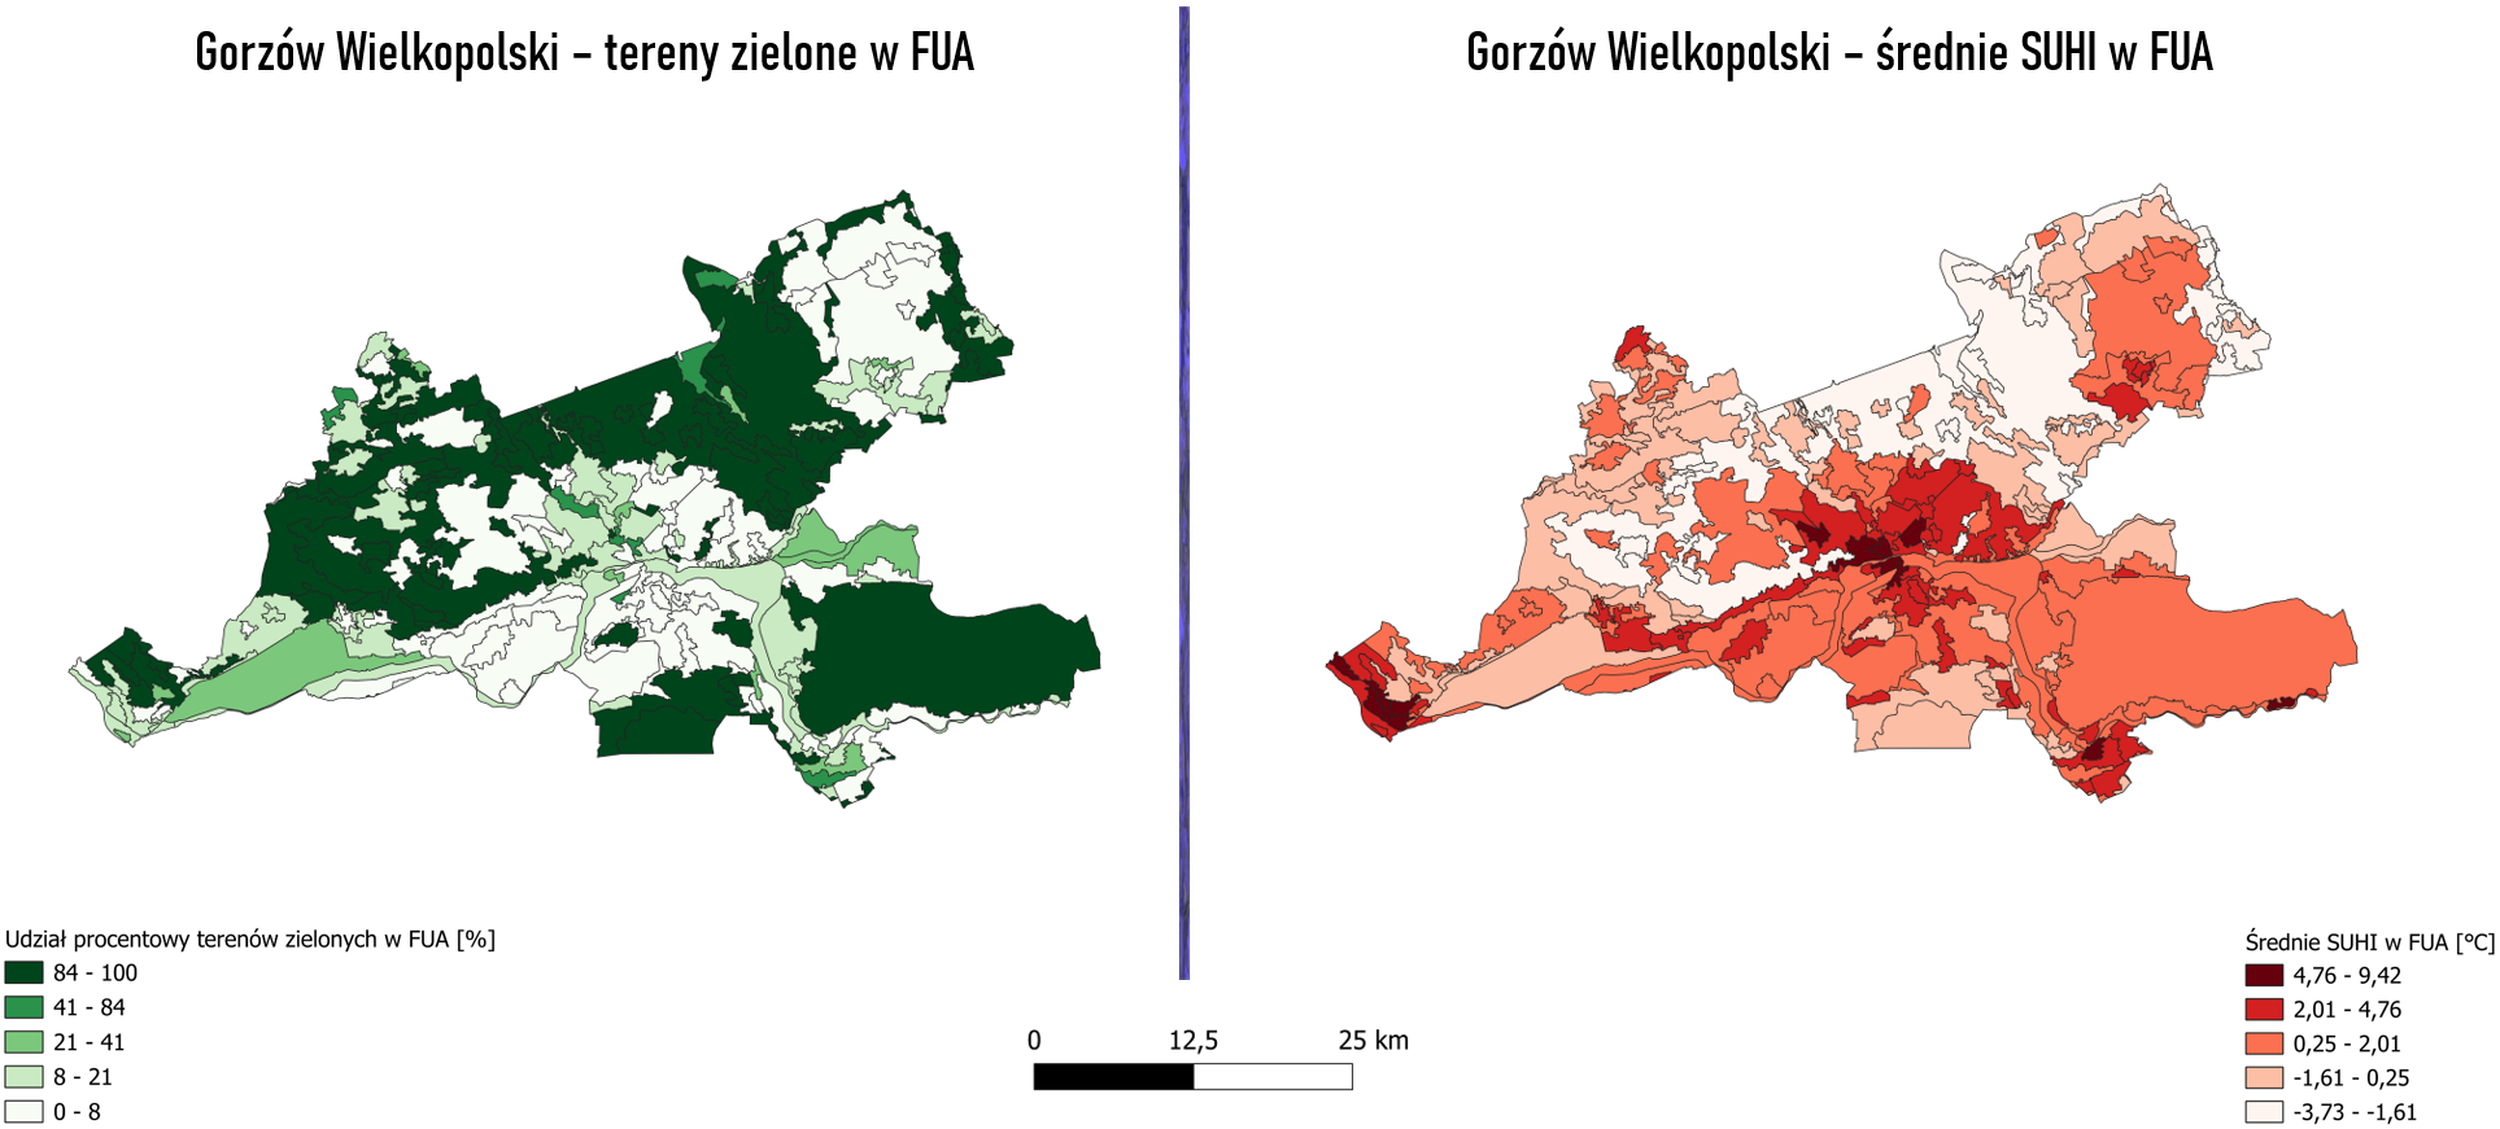
Forested areas, large cemeteries and lakes are among the landscape units with the highest proportion of green or cooling elements, whilst patchwork suburban landscapes and industrial areas are characterised by higher average SUHI values. The role of impervious surfaces is particularly evident: both in the city and within the FUA, an increase in built-up areas leads to a rise in the average SUHI index value.
7. Comparative analysis and application in planning
A comparison of the two FUA areas shows that the cooling effect of the urban heat island can be regarded as an ecosystem service at the landscape level. Zielona Góra is characterised by a denser and more coherent green structure, which mitigates the and provides a broader cooling effect across the FUA area. Gorzów Wielkopolski has a more fragmented green structure and a higher proportion of impervious surfaces, which makes the urban heat island effect more pronounced and persistent across the area.
| Area | Main cooling agent | Main heating element | Implications for planning |
| Zielona Góra (town) | High proportion of green spaces (>60%) | Local industrial clusters and densely built-up residential areas | To safeguard the continuity of forests, parks, allotments and urban green corridors. |
| Zielona Góra (FUA) | Regional forest, agricultural and lake areas | Selected industrial areas and densely populated urban areas | Use suburban areas as a cooling buffer and limit the expansion of impervious surfaces. |
| Gorzów Wielkopolski (town) | Local green spaces, cemeteries and forests | A high proportion of impervious surfaces (~18%) and industrial areas | In areas particularly vulnerable to heatwaves, priority should be given to removing hard surfaces, providing shade and implementing measures under the green-blue strategy. |
| Gorzów Wielkopolski (FUA) | Wooded areas, lakes and regional open spaces | A patchwork of suburban areas, industrial zones and densely populated urban areas | Strengthen the connections between green spaces and maintain ventilation corridors. |
Table 2. Results
In the case of Zielona Góra, the main planning objective should be to maintain the continuity and quality of the existing green infrastructure. Preventing the fragmentation of forests, allotments, parks and suburban green corridors should be considered a priority, particularly in landscape units located near areas with a high SUHI index. In the case of Gorzów Wielkopolski, the priority should be to limit the impact of impervious surfaces and to introduce cooling measures in industrial and warehouse zones and in dense residential areas.
The FUA perspective is crucial for climate change adaptation, as it demonstrates that cooling services are generated not only within the city but also by the surrounding functional landscape. Forests, lakes, agricultural land, open spaces and ventilation corridors located beyond the city’s administrative boundaries can reduce the thermal contrast observed in the city centre. At the same time, the sealing of suburbs and industrial expansion can weaken this regional cooling function.
The proposed approach is suitable for monitoring. Repeated observations from Landsat, supplemented by MODIS data to fill in gaps, as well as vector spatial data from BDOT10k and the landscape audit, can be used to track changes in cooling services over time. As the results are aggregated to landscape units and FUAs, they can support regional spatial planning, climate change adaptation programmes, the valuation of ecosystem services, and the prioritisation of local adaptation measures.
In practice, these results should be used to identify landscape units where the cooling service needs to be protected, restored or enhanced. Units with a low proportion of green spaces and a high proportion of impervious surfaces should be treated as priority areas for adaptation measures. Units with high cooling potential should be protected within the framework of a regional green-blue infrastructure system, particularly where they contribute to improving thermal comfort in neighbouring urban areas.
Bibliography
Bokwa, A., Hajto, M. J., Walawender, J. P., & Szymanowski, M. (2015). Influence of diversified relief on the urban heat island in the city of Kraków, Poland. Theoretical and Applied Climatology, 122, 365–382. https://doi.org/10.1007/s00704-015-1577-9
Bowler, D. E., Buyung-Ali, L., Knight, T. M., & Pullin, A. S. (2010). Urban greening to cool towns and cities: A systematic review of the empirical evidence. Landscape and Urban Planning, 97(3), 147–155. https://doi.org/10.1016/j.landurbplan.2010.05.006
Kłysik, K., & Fortuniak, K. (1999). Temporal and spatial characteristics of the urban heat island of Łódź, Poland. Atmospheric Environment, 33(24–25), 3885–3895. https://doi.org/10.1016/S1352-2310(99)00131-4
Kuchcik, M., Błażejczyk, K., Milewski, P., & Szmyd, J. (2014). Urban climate research in Warsaw: The results of microclimatic network measurements. Geographia Polonica, 87(4), 491–504. https://doi.org/10.7163/GPol.2014.33
Kumar, P., Debele, S. E., Sahani, J., Aragão, L., Barisani, F., Basu, B., Bucchignani, E., Charizopoulos, N., Di Sabatino, S., Domeneghetti, A., Edo, A. S., Finér, L., Gallotti, G., Juch, S., Leo, L. S., Loupis, M., Mickovski, S. B., Panga, D., Pilla, F., … Zieher, T. (2024). Urban heat mitigation by green and blue infrastructure: Drivers, effectiveness, and future needs. The Innovation Geoscience, 2(2), 100071. https://doi.org/10.59717/j.xinn-geo.2024.100071
Majkowska, A., Kolendowicz, L., Półrolniczak, M., Hauke, J., & Czernecki, B. (2017). The urban heat island in the city of Poznań as derived from Landsat 5 TM. Theoretical and Applied Climatology, 128, 769–783. https://doi.org/10.1007/s00704-016-1737-6
Oke, T. R. (1982). The energetic basis of the urban heat island. Quarterly Journal of the Royal Meteorological Society, 108(455), 1–24. https://doi.org/10.1002/qj.49710845502
Półrolniczak, M., Kolendowicz, L., Majkowska, A., & Czernecki, B. (2017). The influence of atmospheric circulation on the intensity of urban heat islands and urban cold islands in Poznań, Poland. Theoretical and Applied Climatology, 127, 611–625. https://doi.org/10.1007/s00704-015-1654-0
Renc, A., Drobniak, A., & Ogrodnik, K. (2022). Spatial structure of surface heat and cold islands in summer based on Landsat 8 imagery in southern Poland. Ecological Indicators, 145, 109645. https://doi.org/10.1016/j.ecolind.2022.109645
Voogt, J. A., & Oke, T. R. (2003). Thermal remote sensing of urban climates. Remote Sensing of Environment, 86(3), 370–384. https://doi.org/10.1016/S0034-4257(03)00079-8
Weng, Q., Lu, D., & Schubring, J. (2004). Estimation of the relationship between land surface temperature and vegetation abundance for urban heat island studies. Remote Sensing of Environment, 89(4), 467–483. https://doi.org/10.1016/j.rse.2003.11.005