Water retention and flood risk as an example of regulating ecosystem services
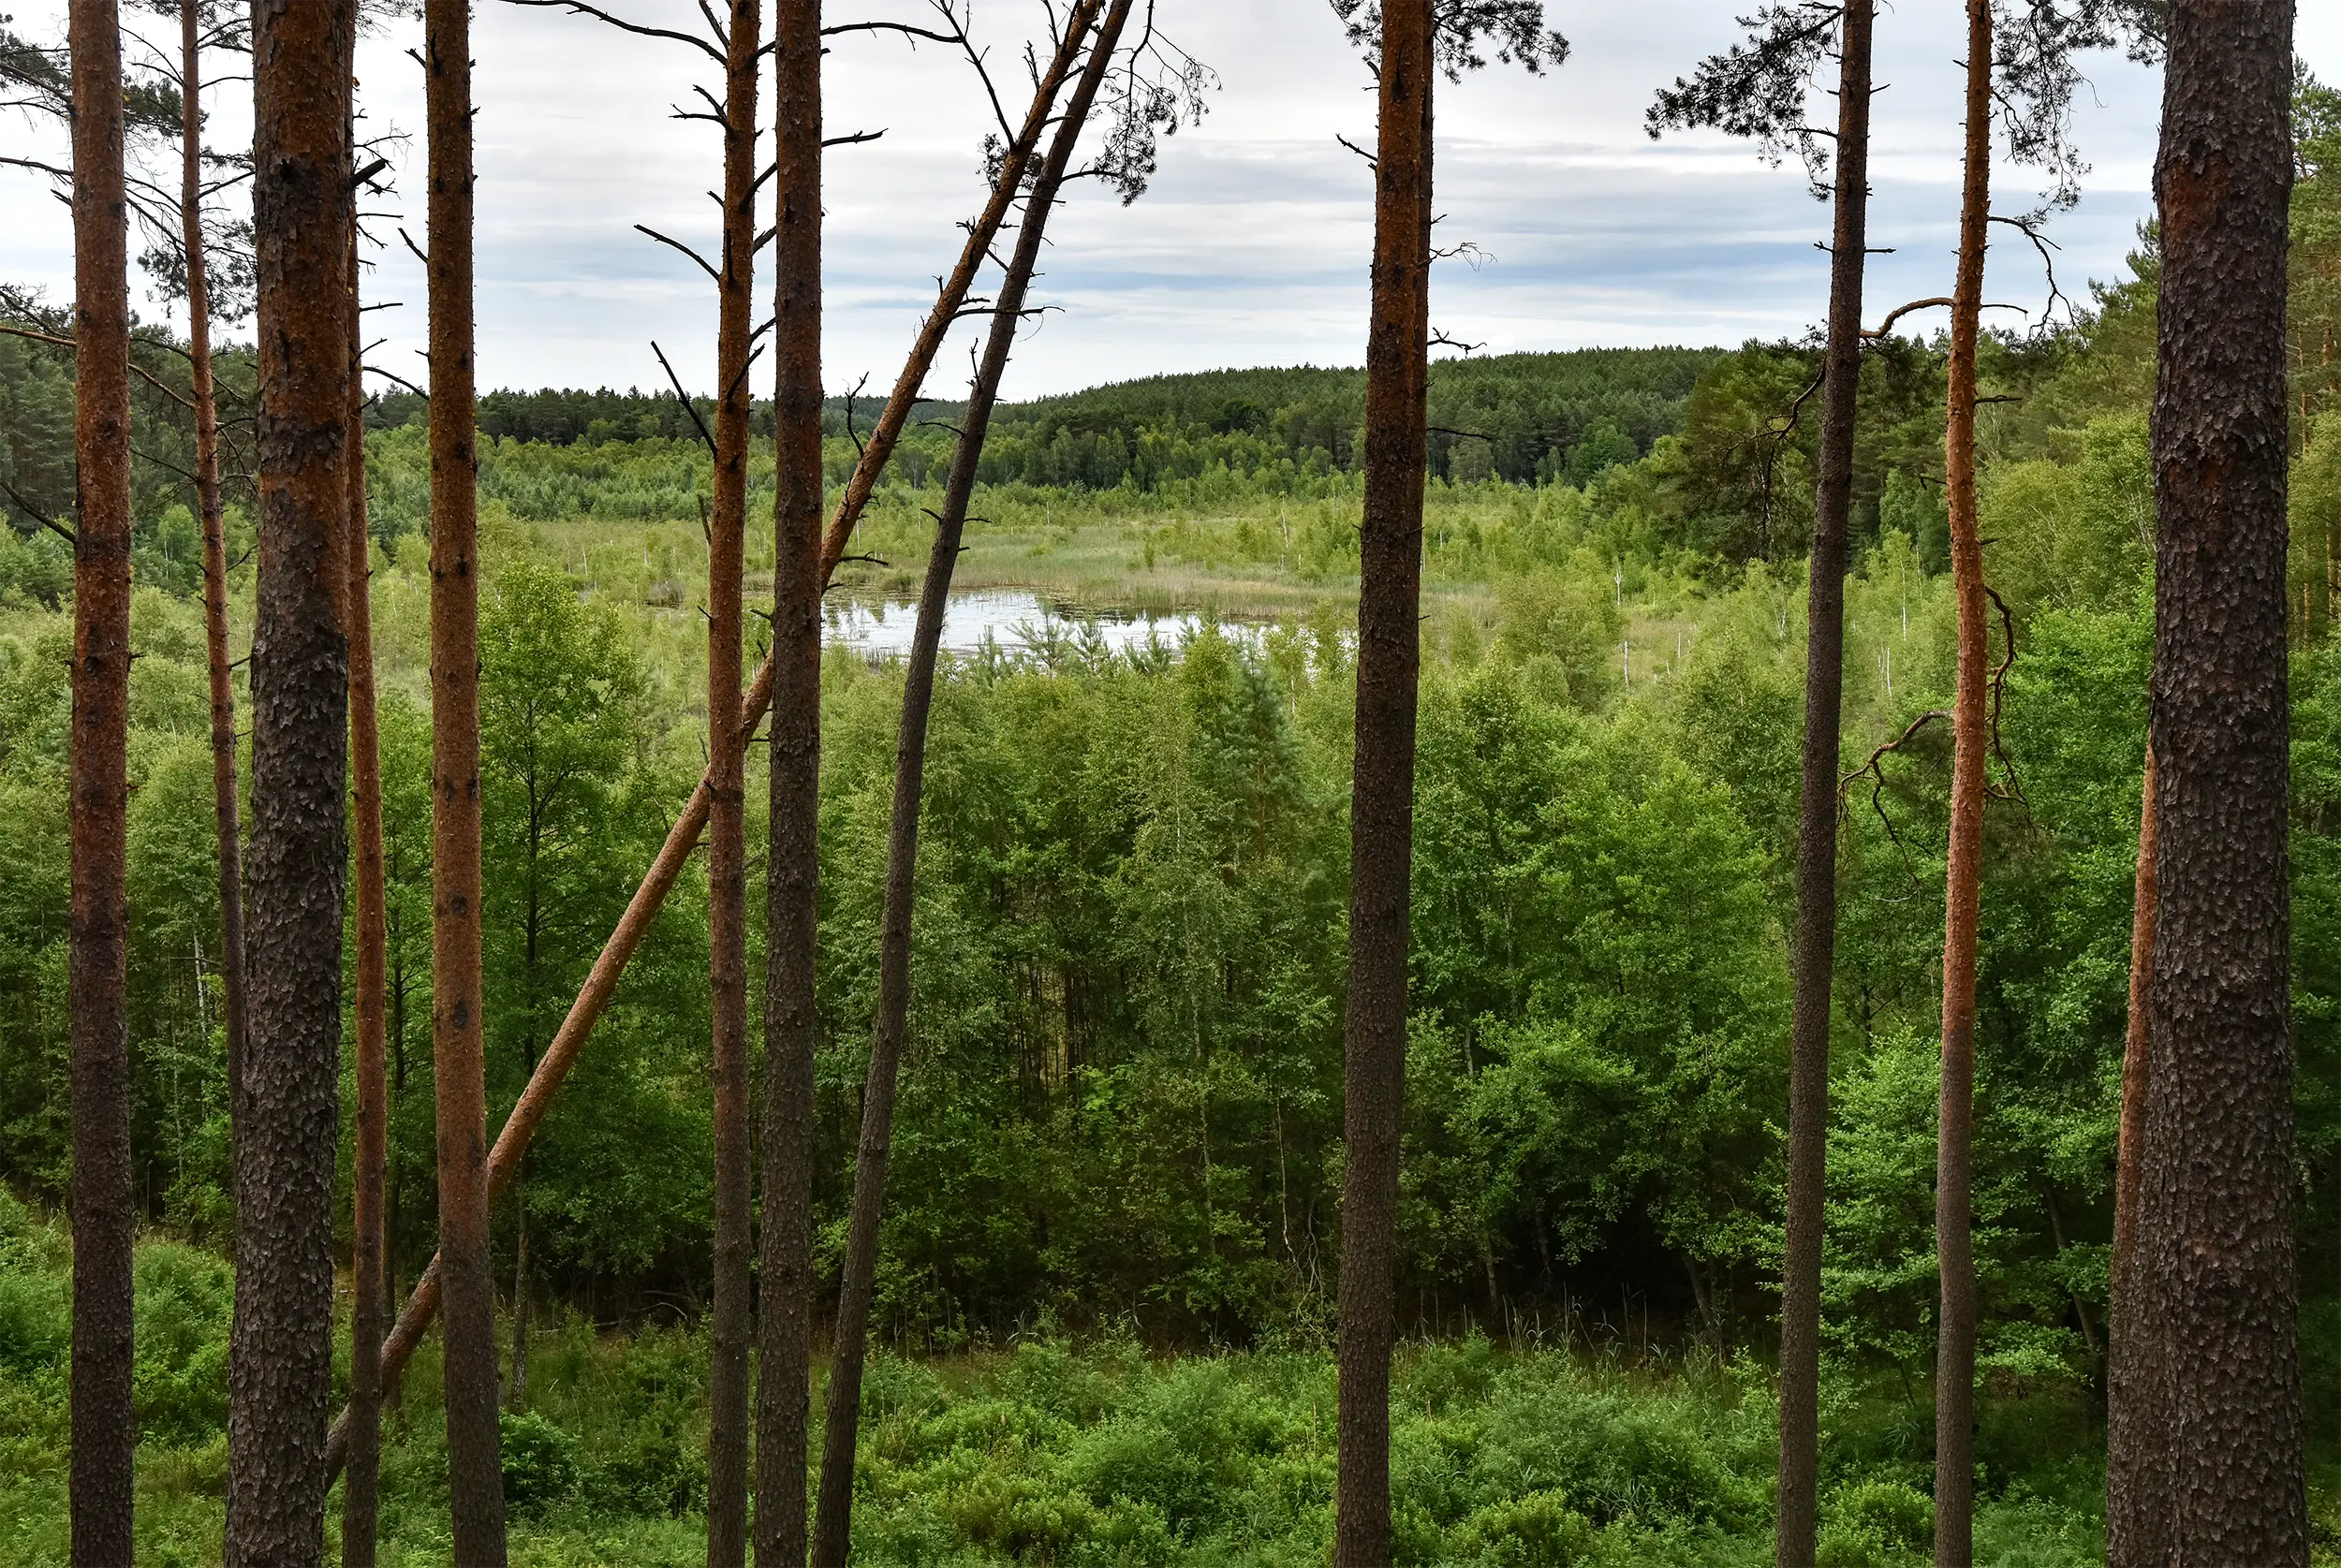
The issue of water retention is of particular importance in the Lubuskie Voivodeship, where the natural environment is characterised by a high proportion of river valleys, wetlands and areas with relatively dynamic hydrological processes. The region lies within the catchment area of major river systems, primarily the Odra valley and the valleys of its tributaries, such as the Warta, Noteć, Bóbr and Nysa Łużycka. The region’s landscape features extensive valley depressions, floodplains, oxbow lakes and periodically flooded areas, which perform an important water retention function.
Natural retention in river valleys plays a key role in stabilising the region’s water balance. Floodplains allow for the temporary storage of excess water during periods of high water, thereby reducing the rate of outflow and lowering the risk of flooding in the lower-lying parts of the catchment area. At the same time, soil and subsurface retention helps to maintain water resources during periods of low rainfall and mitigates the effects of hydrological drought.
The Lubuskie Voivodeship is also characterised by a high proportion of forest cover (~50%), which constitutes one of the most important factors supporting landscape-scale water retention. The structure of the forest vegetation helps to increase infiltration, reduce surface runoff and stabilise the water balance. At the same time, parts of the region are subject to significant anthropogenic pressure linked to urbanisation, infrastructure development and hydrotechnical alterations to river valleys.
In the context of advancing climate change, the importance of landscape retention in the region is growing even further. Periods of heavy rainfall leading to local flooding, as well as prolonged periods of water scarcity, are being observed with increasing frequency. The landscape’s ability to retain and gradually release water is therefore becoming one of the key factors in enhancing the resilience of the environment and water management to extreme events.
In this context, the spatial identification of areas with high and low water retention potential is of significant practical importance. The results of the analyses carried out as part of this study may support:
- planning of flood prevention measures,
- protection of floodplains,
- the restoration of river valleys,
- the development of blue-green infrastructure,
- spatial planning,
- climate change adaptation measures.
The development of a landscape retention index for the Lubuskie Voivodeship therefore enables not only an analysis of the functioning of the aquatic environment, but also the identification of areas of particular importance for maintaining the region’s hydrological security.
1. Water retention
1.1. What is retention?
Retention refers to the environment’s ability to retain and temporarily store water. This process involves both the accumulation of water on the ground surface and its storage in the soil, vegetation, wetlands and underground aquifers.
Water retention plays a key role in the hydrological cycle. Among other things, it influences:
- reducing the rapid runoff of rainwater,
- flood risk reduction,
- stabilisation of river outflow,
- groundwater recharge,
- mitigating the effects of drought,
- maintaining the moisture levels of habitats and ecosystems,
- reducing the risk of fire.
Under natural conditions, the landscape’s water retention capacity is determined by a number of interacting factors, such as land cover, vegetation structure, soil permeability, topography and the presence of wetlands. Water retention plays a key role in shaping the water balance, mitigating the effects of drought and flooding, and in planning the sustainable management of water resources. Its level is strongly dependent on natural and anthropogenic conditions.
1.2. Landscape retention
Landscape retention is a specific type of environmental retention that refers to the capacity of the entire landscape to capture, store and gradually release water. It encompasses both natural processes and those dependent on land use. In practice, landscape retention is the result of the interaction between:
- hydrological processes,
- soil properties,
- land cover,
- vegetation structures,
- landforms,
- the extent of anthropogenic environmental change.
Nowadays, the importance of landscape retention is constantly growing due to:
- climate change,
- an increase in the frequency of extreme events,
- urbanisation,
- surface sealing,
- the degradation of wetlands,
- simplification of the landscape structure.
The assessment of landscape water retention is therefore becoming a key element of spatial planning, environmental protection and water resource management.
High-retention landscape:
- slows down surface runoff,
- increases infiltration,
- stores water in the soil and vegetation,
- balances water levels,
- improves the environment’s resilience to extreme weather events.
In contrast, a landscape with low water retention is characterised by rapid runoff of rainwater, limited infiltration, and greater susceptibility to droughts and flash floods.
1.3. Geoinformation and Earth Observation technologies in water retention modelling
Estimating water retention using satellite imagery is based on the analysis of Earth Observation (EO) data. Data from the ESA Copernicus programmes are particularly useful in this context. Data from the Sentinel-1 (SAR radar), Sentinel-2 (optical, multispectral) and Sentinel-3 (hydrological and climatic parameters). Based on these, EO-derived products are created, such as soil moisture indicators, vegetation indices (e.g. NDVI, NDWI), land cover maps, surface sealing maps and maps of seasonal variability in water bodies.
The methodology for estimating water retention involves integrating these products within a GIS environment, where it is possible to combine satellite data with reference information (terrain models, soil, hydrographic and meteorological data) and to model natural phenomena. Spatial and temporal analyses enable the identification of areas with increased or decreased retention capacity, the assessment of the impact of land-use changes, and the modelling of water management scenarios. This approach allows for an objective, repeatable and scalable assessment of water retention, supporting decision-making processes at local and regional levels.
This study aims to provide a quantitative and relative estimate of water retention for the entire Lubuskie Province. A raster-based geodata processing model was adopted, with both input and output data set at a resolution of 20 m per pixel.
2. A multi-criteria water retention index based on the SWAT model and landscape geodata
To assess landscape retention, a multi-criteria index was developed based on the results of the SWAT hydrological model and spatial data describing land cover structure. The methodology adopted enables the identification of areas with high and low retention capacity and allows for the analysis of the structural landscape features that influence them. The model utilises two core components: a hydrological component and a landscape component.
2.1. Hydrological component (SWAT)
In studies on water retention in the Lubuskie Voivodeship, the SWAT+ (Soil and Water Assessment Tool Plus) hydrological model (Texas A&M; University, n.d.), operating within the QGIS environment via the QSWAT+ extension. This tool is one of the most widely used hydrological models in the world and represents a development of the classic SWAT model, which has been used for years in analyses of catchment areas, water management and the impact of climate change on the environment. SWAT+ was selected due to the high maturity of the technology, broad support from the scientific community, and the ability to map processes occurring within the catchment in great detail whilst maintaining a relatively transparent structure of input and output data. The model enables the simulation of the water cycle in the environment, taking into account, amongst other things, terrain, soil types, land use and weather conditions.
Several key spatial and environmental data sources were used to carry out the simulation. The analysis was based on a Digital Elevation Model with a resolution of 20 metres per pixel, which enabled the terrain and natural water flow directions to be mapped. Information on soil properties was drawn from the HWSD (Harmonized World Soil Database) (FAO/IIASA/ISRIC/ISSCAS/JRC, 2012), which contains data on soil structure, permeability and water-holding capacity. The analysis also took into account land-use data, such as forests, agricultural land and built-up areas, prepared and made available by the developers of the SWAT+ model. Weather data generated by the SWAT+ weather system, based on the global CFSR (Climate Forecast System Reanalysis) database containing historical meteorological data, was also a key component.
Based on the data collected, a simulation of the processes occurring in the aquatic environment of the Lubuskie Voivodeship was carried out using the SWAT+ model. The model generated a series of thematic layers describing key parameters of the water cycle. These included, amongst others, data on precipitation, soil moisture, evapotranspiration (the process by which water is released into the atmosphere by soil and vegetation), infiltration (the process by which water seeps into the ground), and surface runoff (the movement of water across the ground surface). The resulting layers formed the basis for further analyses related to the assessment of the region’s water retention capacity and the identification of areas particularly vulnerable to water shortages or surpluses.
In this study, these layers were used to construct the hydrological component of the landscape retention index. It was assumed that the hydrological processes best describing the environment’s capacity to retain, store and transform water are:
- infiltration (INF),
- soil water content (SW),
- surface drain (SURQ),
- evapotranspiration (ET).
Infiltration is one of the most important retention mechanisms, as it is responsible for water entering the soil profile and replenishing subsurface storage. Areas with high infiltration are characterised by a greater capacity to reduce rapid surface runoff and better storage of water resources. Increased infiltration also enables more effective recharge of groundwater and stabilisation of the water balance over the long term.
The second key parameter is soil water content, which describes the amount of water retained within the soil profile. This parameter reflects the water-holding capacity of the environment and the landscape’s ability to maintain moisture over a longer period of time. High soil moisture values are characteristic of areas with favourable retention conditions and increased resilience to periodic rainfall shortages.
Surface runoff, however, is a factor limiting retention. High runoff values indicate that rainwater leaves the system rapidly, resulting in limited infiltration and increased susceptibility to erosion and flooding. Intense surface runoff shortens the time water spends in the landscape and limits its storage capacity. In the indicator model, this parameter has been incorporated by inverting the scale, so that lower runoff corresponds to higher retention potential.
The hydrological component also includes evapotranspiration, which describes the combined process of evaporation from soil surfaces and water bodies, and plant transpiration. Evapotranspiration is one of the fundamental elements of the water cycle and plays a significant role in the functioning of the landscape. High evapotranspiration values are often found in areas characterised by well-developed vegetation, high water availability and active exchange processes between the atmosphere, soil and biosphere. For this reason, this parameter may indirectly indicate well-functioning environments with high hydrological and biological activity. In natural landscapes, increased evapotranspiration often co-occurs with high infiltration, well-developed vegetation cover and favourable retention conditions.
The values of the above characteristics are expressed in the same unit to facilitate calculations: millimetres of water per square metre. Their average values for the year 2025 were selected to calculate the hydrological retention index.
Selected SWAT layers were normalised to a common range of [0…1], which enabled their integration with the component representing the landscape structure. This approach allows real-world hydrological processes to be combined with spatial retention conditions, creating a comprehensive indicator of the landscape’s water retention capacity.
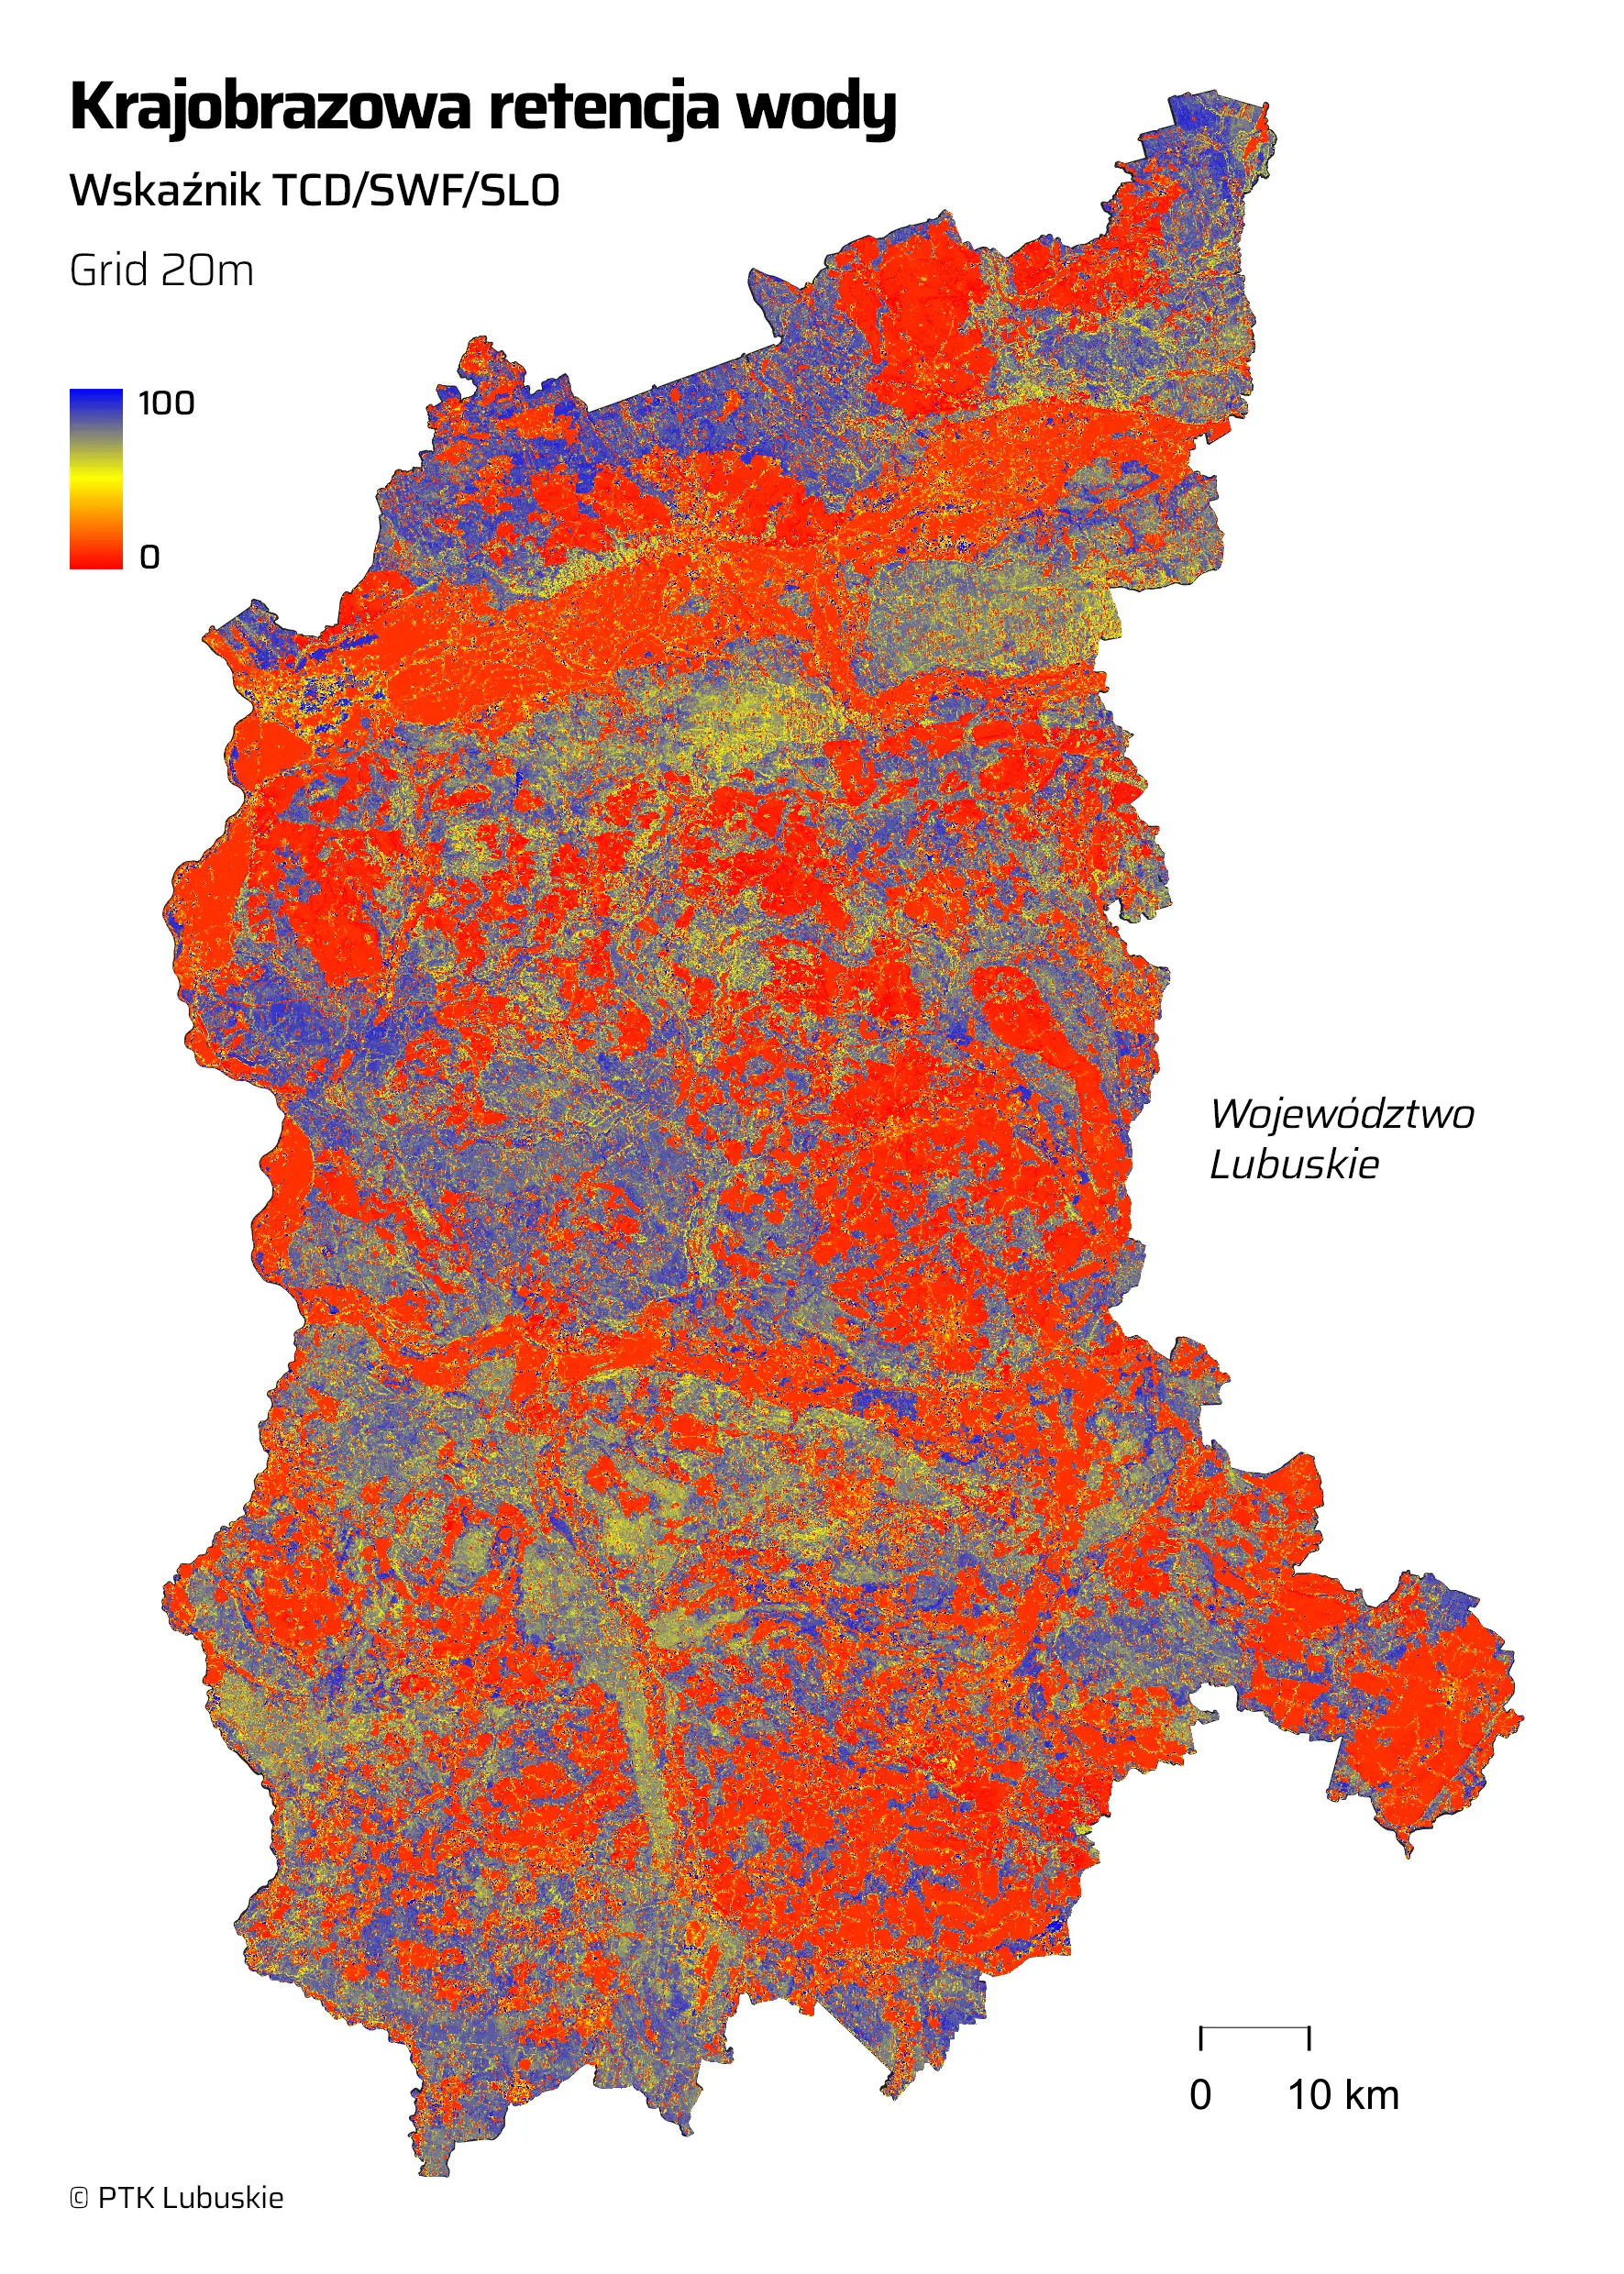
2.2. Structural landscape retention component
The selected layers represent the landscape’s potential water retention capacity, which is determined by land cover, vegetation structure and density, and landform morphology:
- Tree Cover Density (TCD),
- Small Woody Features (SWF),
- Impervious Density (IMD),
- Slope of the terrain (SLO).
Tree Cover Density (TCD) describes the percentage of the area covered by tree canopies within the analysed area. This indicator serves as an indirect measure of forest cover and the density of tree cover, and thus enables an assessment of the impact of tall vegetation on hydrological processes. The presence of trees significantly affects the landscape’s ability to retain water by intercepting part of the precipitation through tree canopies (interception), increasing infiltration and improving the physical properties of the soil. An extensive root system increases soil porosity and creates additional pathways for water migration to deeper layers of the soil profile. Areas characterised by high TCD values often exhibit reduced surface runoff, greater water-holding capacity and greater resilience to periodic water shortages. For this reason, the TCD index was treated as a factor positively influencing landscape water retention potential.
Small Woody Features (SWF) refers to the proportion of small woody and shrubby vegetation occurring outside compact forest complexes, such as field trees, tree-lined avenues, green belts, shrubbery, hedgerows or small clusters of trees. Despite their relatively small area, these elements perform an important hydrological and ecological function. They act as natural barriers that slow surface runoff, reduce erosion and increase infiltration by locally improving soil structure. The presence of small woody vegetation also increases the roughness of the terrain, which prolongs the residence time of water in the landscape and promotes its retention. In agricultural and heavily anthropogenically altered landscapes, SWF often plays a significant role as an element that increases local retention potential.
Impervious Density (IMD) measures the degree to which a land surface is sealed off due to the presence of man-made infrastructure, such as buildings, roads, car parks and other impervious surfaces. High values of the index indicate a reduction in natural infiltration processes and an increase in the proportion of rapid surface runoff. Surface sealing leads to a reduction in water retention time within the landscape, a reduction in groundwater recharge, and an increased susceptibility to flash floods following heavy rainfall. Unlike the other parameters used in the model, the IMD was not treated as an equal component of the index, but as a factor limiting the functioning of the entire retention system. With a high degree of sealing, the landscape’s retention potential is significantly reduced, regardless of the favourable environmental conditions present in a given area.
Slope gradient (SLO) describes the inclination of the land surface and is one of the key parameters influencing the dynamics of hydrological processes. The slope of the terrain directly affects the speed at which water moves across the surface and the time it spends in the landscape. Areas with gentle slopes help to slow surface runoff and increase infiltration, allowing water to be stored for longer in the soil and subsurface layers. Conversely, steep slopes increase flow energy, accelerate runoff and limit water retention capacity. Steeply sloping terrain is also more susceptible to erosion processes, which can further deteriorate retention conditions. In the landscape retention model, the slope parameter was incorporated after inverting the scale of values, so that a lower slope corresponds to more favourable retention conditions.
2.3. Methodological assumptions
The model assumes that all factors used to construct the indicators have an equal influence. No weights were applied, as there is no clear empirical basis for determining the relative impact of individual processes on landscape retention in this case. Whilst this approach certainly represents a form of averaging, it eliminates arbitrariness in the model and enhances methodological transparency, whilst also facilitating the interpretation of results and the expansion of the indicator.
3. Data normalisation
The individual input layers are characterised by different units and ranges of values. Consequently, all data has been converted to a common scale of 0–1.
For criteria that have a positive impact on retention, ascending normalisation was applied:
- infiltration (INF’),
- soil water content (SW’),
- Tree Cover Density (TCD),
- Small Woody Features (SWF).
For the criteria limiting retention, a decreasing normalisation was applied:
- surface drain (SURQ’),
- Impervious Density (IMD),
- gradients (SLO’).
After normalisation, all layers are interpreted uniformly:
- high values indicate a positive effect on retention,
- Low values indicate limited water-holding capacity.
4. Design of the indicator
The landscape retention index has been divided into two independent components.
4.1. Calculation of the hydrological retention coefficient
It sets out the actual water cycle processes according to the following relationship:
WRH = [ ( INF’ + SW’ + ET’ ) / 3 ] – SURQ’
where:
- INF — infiltration,
- SW — soil water content,
- SURQ — surface drain,
- ET — evapotranspiration.
Unit: mm/m² (input and output). The values were then normalised to the range [0…1].
4.2. Calculating the landscape retention index
It describes the landscape’s spatial retention capacity:
WRL = ( TCD’ + SWF’ + SLOPE’ ) / 3
where:
- TCD — Tree Cover Density,
- SWF — Small Woody Features,
- SLOPE — the gradient of the terrain.
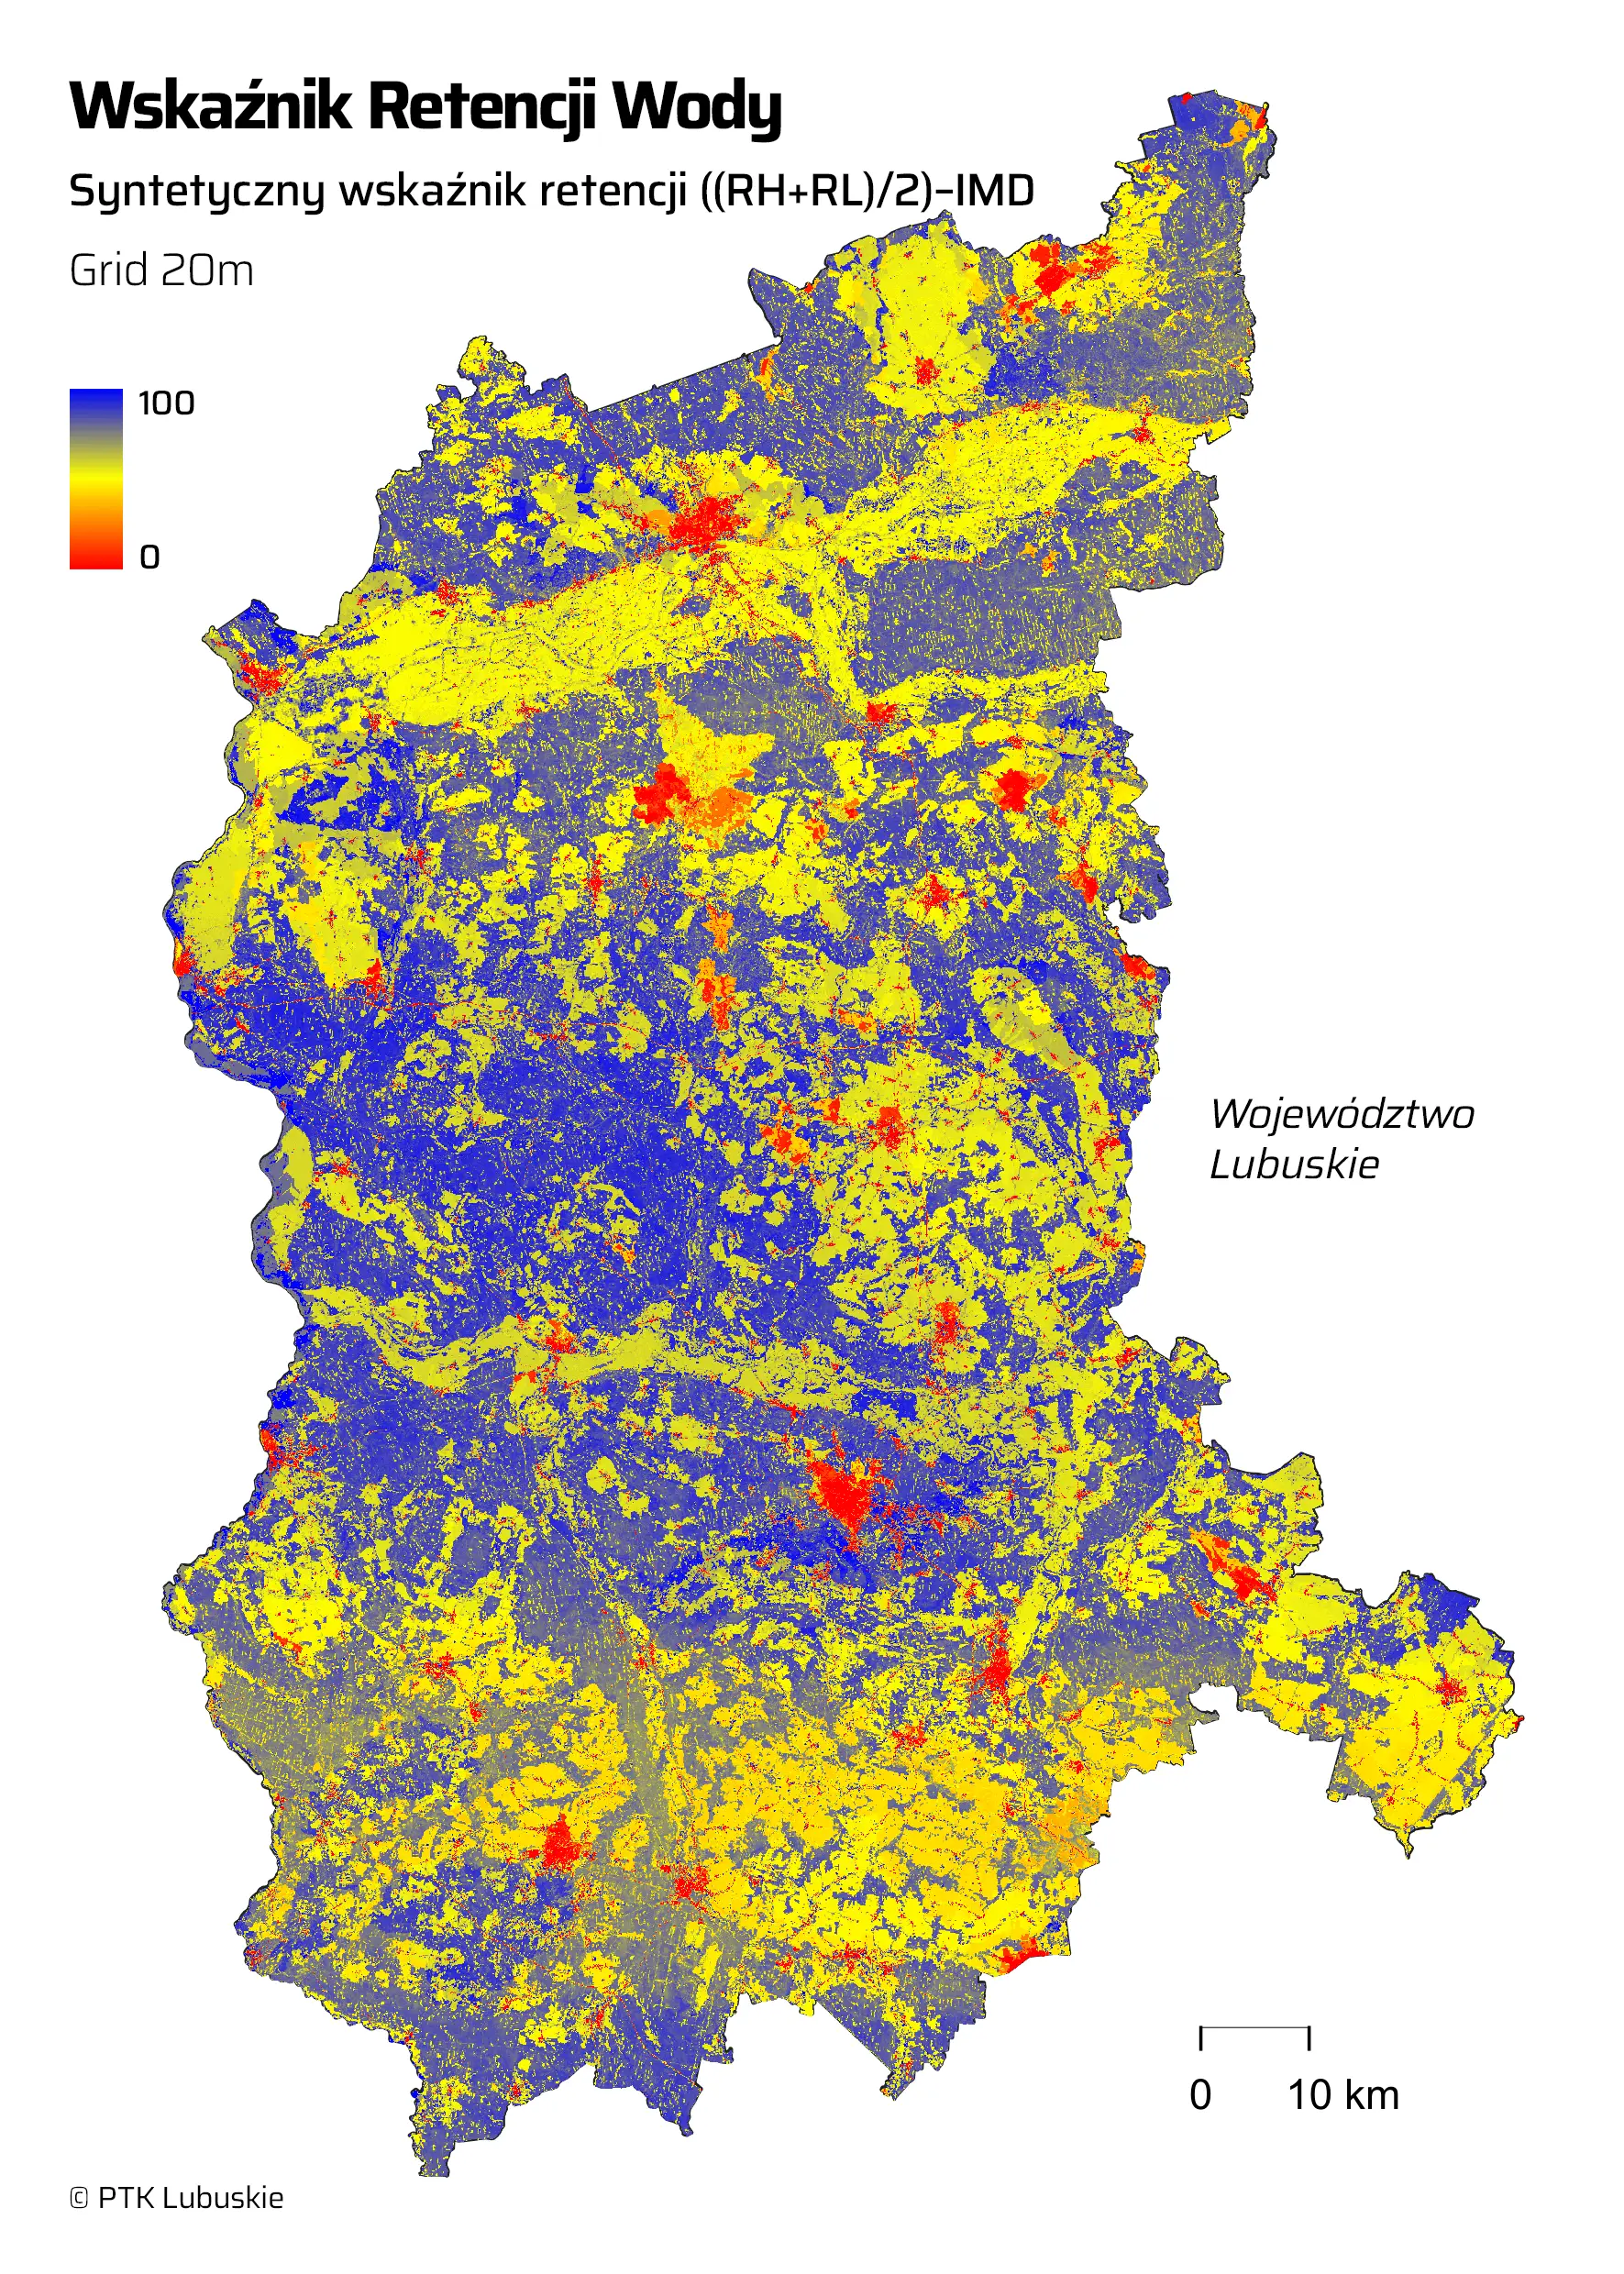
4.3. Final water retention coefficient
The final index is calculated using the following formula:
WRI = [ ( ( WRH + WRL ) / 2 ) × ( 1 – IMD’ ) ] * 100
All input components have value ranges of [0…1]. The average of the two main components is multiplied by the inverse of the CLMS layer ‘Density of sealed areas’ (IMD), based on the assumption that an area that is 100% sealed has a retention value of 0. In other words, the IMD layer acts here as a mask for the layer, with variable density.
The final part of the formula scales the index values to a convenient range of [0…100], and after conversion to 8UInt mode, the image takes on its final form.
5. Results
The result of this study is a set of thematic maps illustrating the hydrological and landscape components, as well as the final water retention index. The same colour scale has been applied to all maps (despite differences in the value ranges of the files). This facilitates the comparison of the relationships and spatial distribution of the analysed features.
High values of the indicator
(shown in blue on the map) indicate areas:
- highly water-permeable,
- which store soil moisture,
- with low surface runoff,
- covered in lush vegetation,
- with high water retention capacity.
The most common ones are:
- forests,
- wetlands,
- river valleys,
- areas with high permeability.
Low index values
(shown in red on the map) indicate areas:
- tightly sealed,
- prone to rapid outflow,
- with limited infiltration,
- at risk of soil erosion,
- at risk of hydrological drought.
The most common ones are:
- urban areas,
- intensively farmed agricultural land,
- areas with steep gradients,
- areas with sparse vegetation.
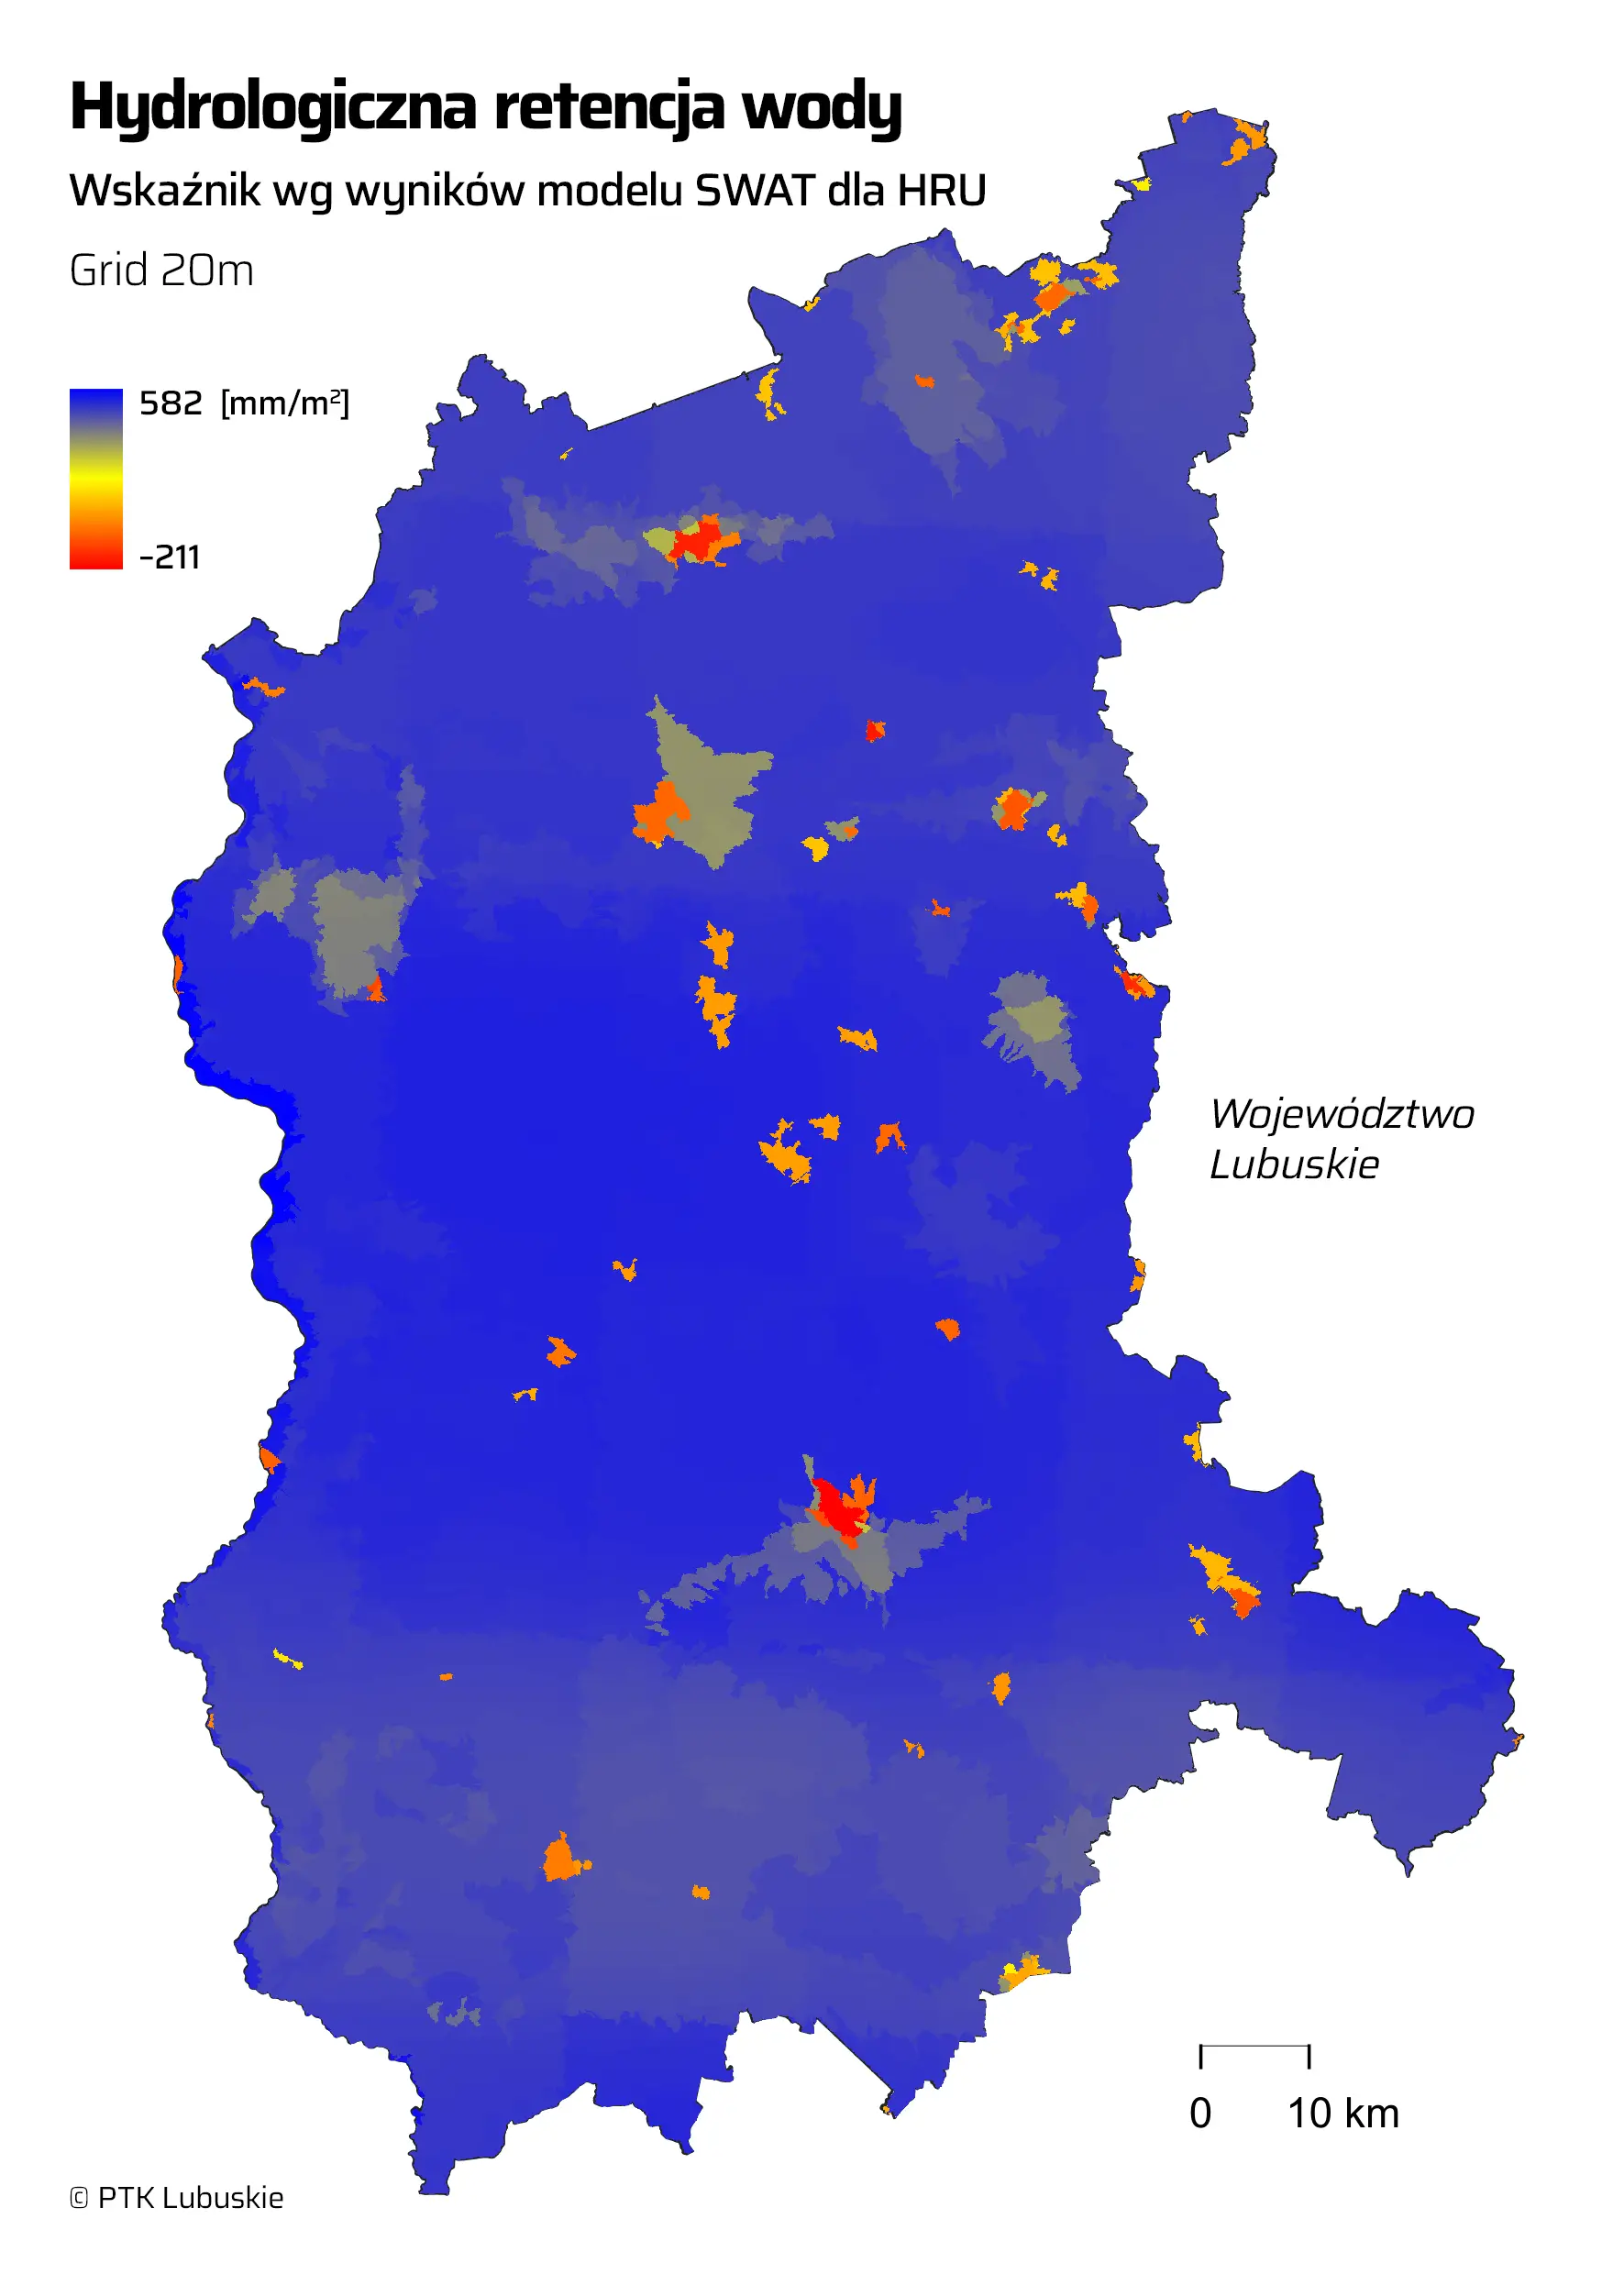
Why are there ‘clusters’ of similar values on the hydrological retention index map?
A key feature of the SWAT model is the way in which the computational domain is organised. The model does not perform calculations directly for individual raster pixels, but instead uses so-called HRUs (Hydrologic Response Units). These are distinct catchment or sub-catchment areas with relatively homogeneous environmental characteristics, defined on the basis of a combination of land use, soil type and terrain slope class.
The process of defining HRUs is one of the key stages in model development, as it influences how hydrological processes are represented spatially. Hydrological parameters are calculated separately for each HRU unit and then aggregated to that level. Their spatial extent can be defined to some extent via the SWAT settings; however, generating a larger number of them (with a decreasing area) makes little sense given the limit on the detail of the input data.
This means that the model’s final results are always referenced to the HRU, hence a certain ‘discretisation’ of the spatial distribution of the index. It should be noted, however, that its values appear to be entirely reasonable and realistic, given the range [-211…582] mm. Why are there negative values for the index? Hydrological parameters in the SWAT model are calculated for average precipitation; in this case, this is 680–889 mm/year for the province in 2025. The index takes on negative values for sealed areas with low retention, which does not compensate for the net amount of rainfall. In essence, therefore, negative values of the index represent runoff from the impervious area. This is particularly evident for the HRU covering the highly urbanised area of Zielona Góra.
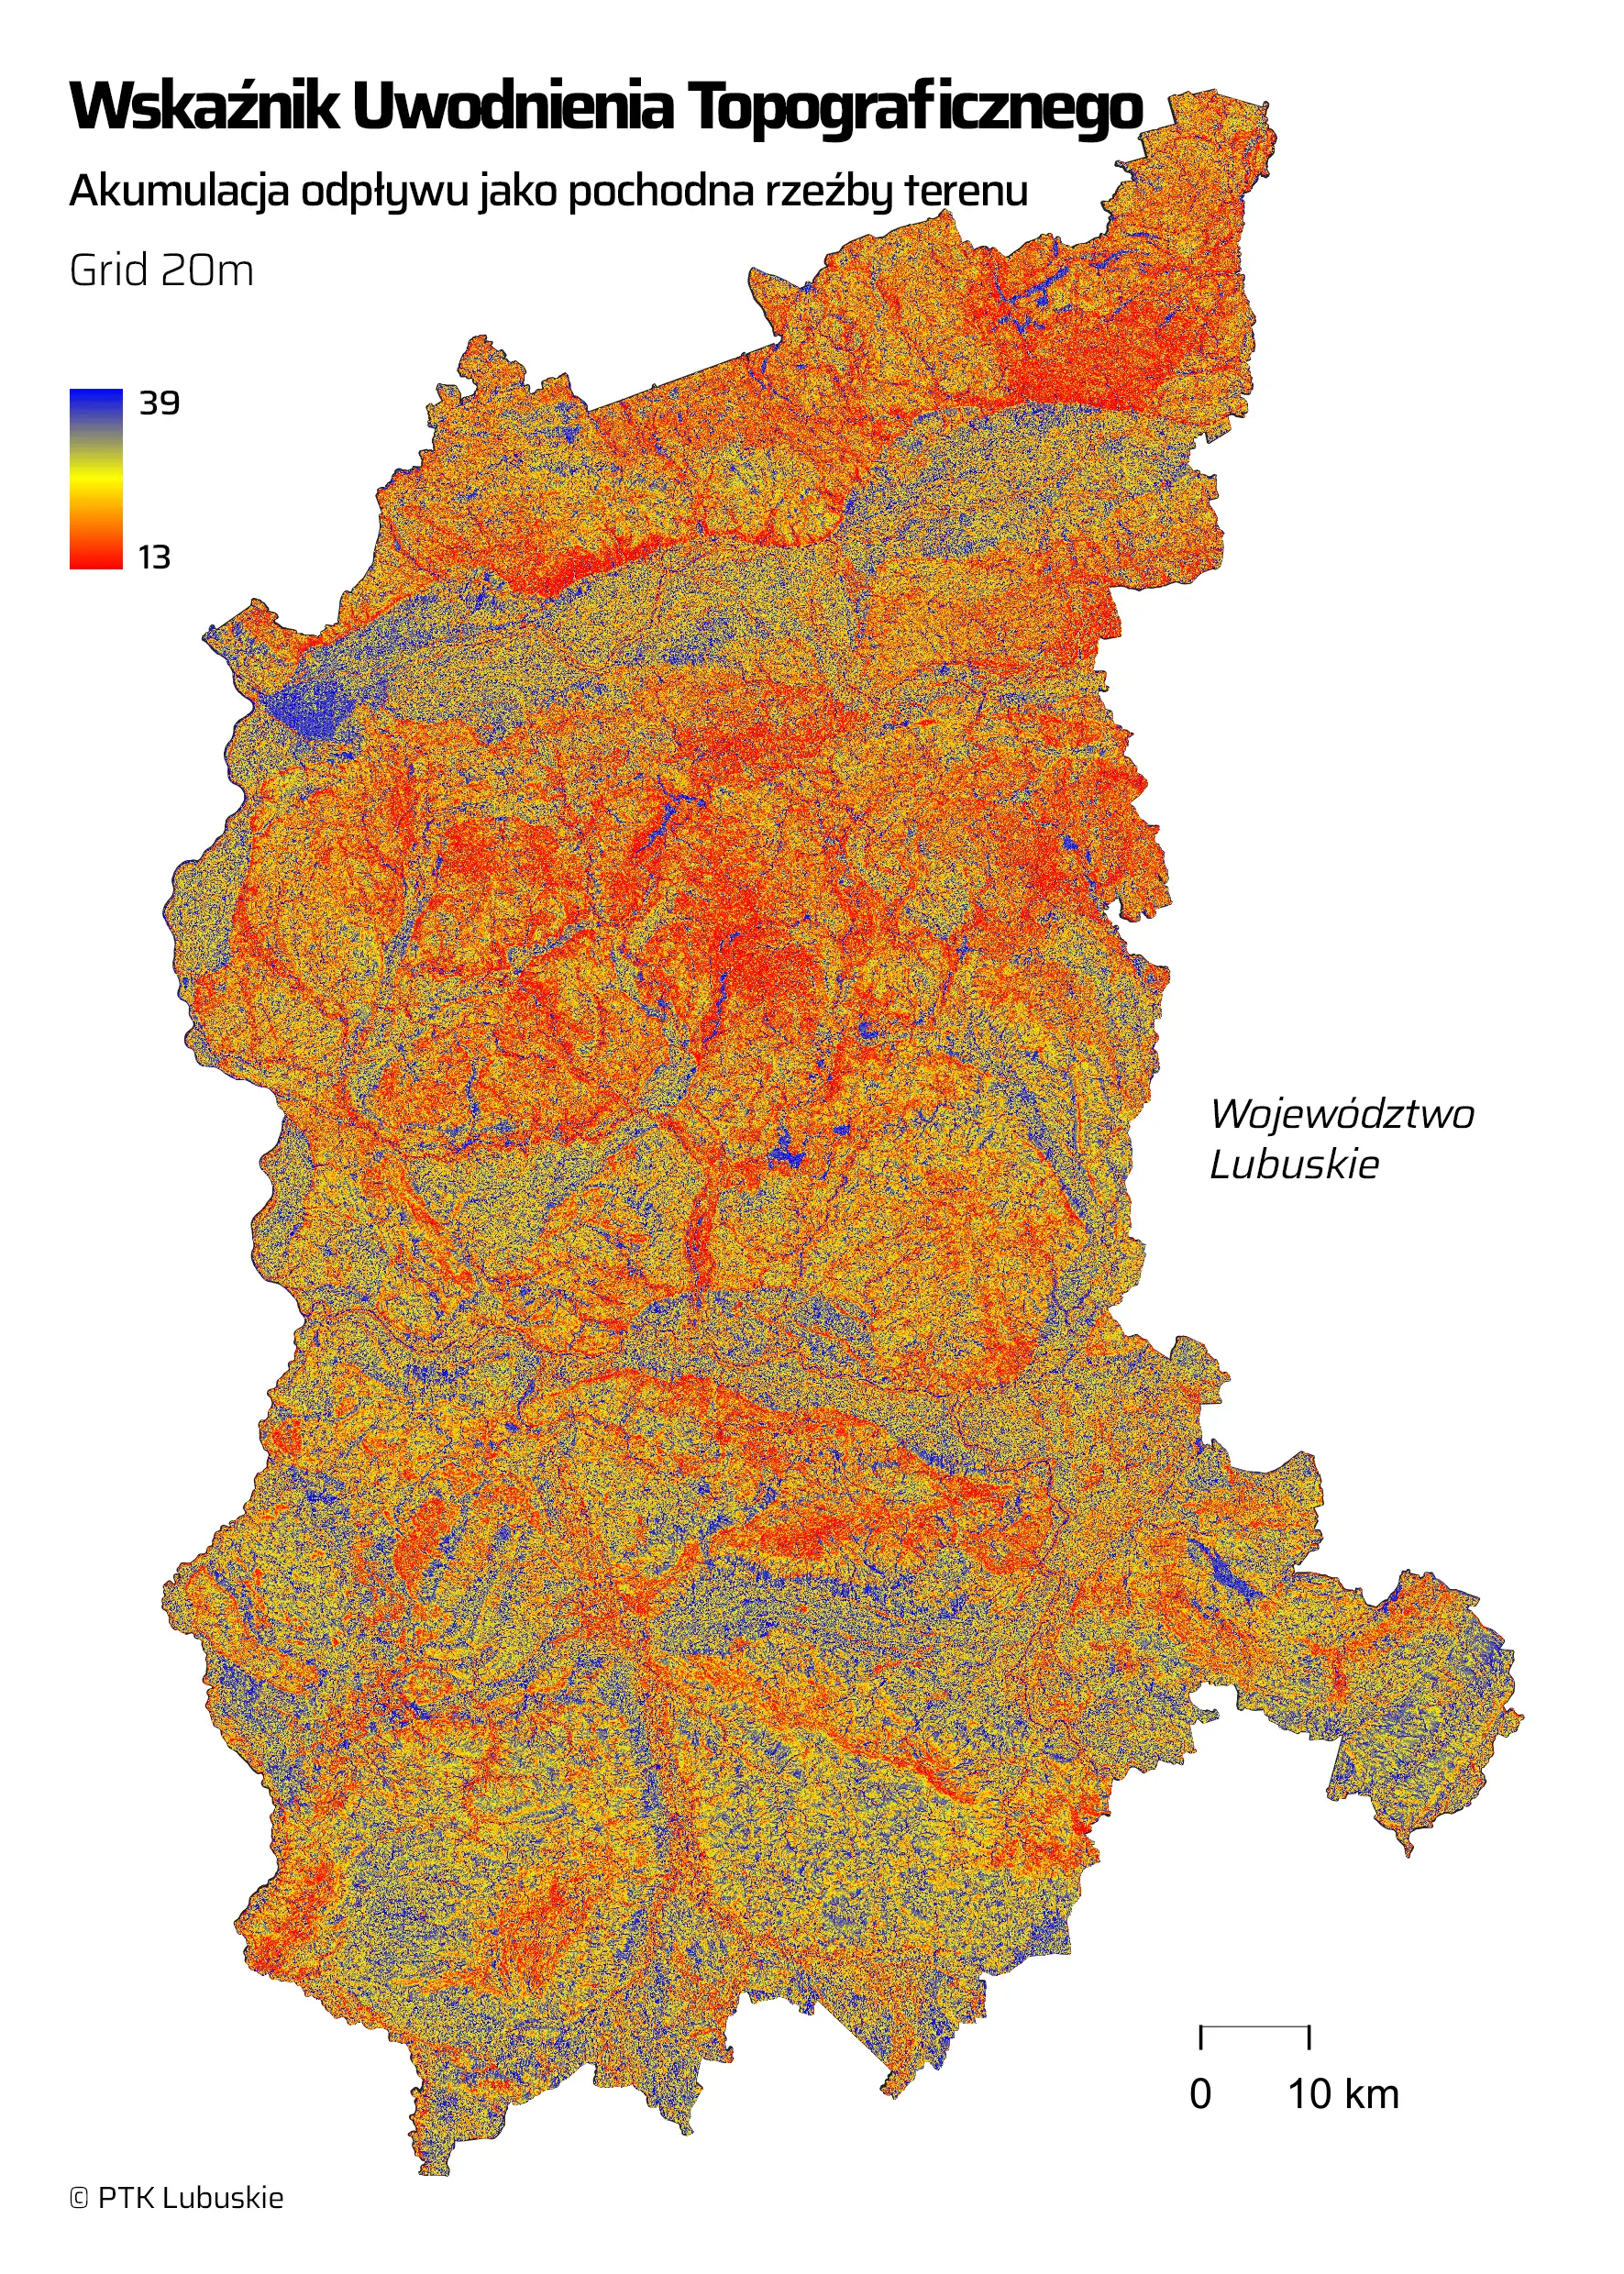
6. The Topographic Wetness Index as a supplementary layer to the issue
To complement the analysis of water retention in the Lubuskie Province, a TWI (Topographic Wetness Index) was also developed for the entire province. The TWI is one of the most commonly used topographic indices in hydrological and geomorphological analyses to identify spatial variations in potential soil moisture. It determines a given area’s propensity for water accumulation resulting from local topographical conditions and is based on the relationship between the catchment area of a given point and the local slope of the terrain. High TWI values indicate areas with an increased potential for moisture accumulation and retention, whilst low values identify locations predisposed to faster water runoff (Beven, K.J., Kirkby, M.J., 1979).
Unlike the components used in the construction of the water retention index, the TWI does not describe the actual hydrological processes modelled by SWAT or the properties of land cover. This index is based solely on morphometric parameters calculated from a digital elevation model. This means that the TWI represents potential conditions conducive to moisture concentration resulting from the geometry of the terrain, without taking into account the influence of land use, soil type, vegetation or infiltration processes. For this reason, the index was not directly included in the calculations of the final retention index, as some of the information contained in the TWI is already indirectly represented by the hydrological and structural parameters used, particularly by slope gradients and the results of the SWAT model.
Nevertheless, it provides a valuable layer to aid in the interpretation of the results obtained. It can be used to verify, on a spatial basis, the consistency between areas with high retention potential and local terrain conditions conducive to water accumulation. (Grabs, T., Seibert, J., Bishop, K., Laudon, H., 2009). Areas with a high retention index and, at the same time, high TWI values may indicate locations of particular importance for the functioning of natural hydrological processes. Conversely, discrepancies between TWI values and the final retention index may indicate a significant influence of anthropogenic factors or land cover characteristics that modify natural water cycle conditions. In practice, TWI can therefore serve as an additional tool to support the interpretation and validation of water retention model results.
The high utility of this indicator is demonstrated by its strong visual correlation with the flood areas affected in the Lubuskie Province in autumn 2024 (this layer is available on the map service under the ‘Supplementary thematic layers’ group).
7. Applications of the results
The indicator developed can be used, amongst other things, for:
- identifying areas requiring retention measures,
- supporting spatial planning,
- environmental and climate analyses,
- assessments of the impacts of urbanisation,
- drought vulnerability analyses,
- supporting restoration initiatives.
By combining SWAT hydrological modelling with spatial data, it is possible to obtain a comprehensive assessment of how landscape retention works.
Summary
The methodology presented here offers a universal and transparent approach to assessing landscape retention within a GIS environment. The combination of hydrological and structural components allows for the analysis of both actual water cycle processes and the spatial conditions affecting retention.
The absence of weighting for individual factors reduces the arbitrariness of the model and enhances its methodological transparency. At the same time, the index’s design allows for further expansion to include additional environmental layers and for calibration based on field data or hydrological monitoring results.
The methodology can be applied to both local and regional analyses, supporting measures related to climate change adaptation and the sustainable management of water resources.
Bibliography
Aloui S., Mazzoni A., Elomri A., Aouissi J., Boufekane A., Zghibi A. (2023). A review of Soil and Water Assessment Tool (SWAT) studies of Mediterranean catchments: Applications, feasibility, and future directions. Journal of Environmental Management, Volume 326, Part B, ISSN 0301-4797.
https://doi.org/10.1016/j.jenvman.2022.116799.
Arnold, J.G., Kiniry, J.R., Srinivasan, R., Williams, J.R., Haney, E.B., Neitsch, S.L. Soil and Water Assessment Tool – Input/Output Documentation. Texas Water Resources Institute, Texas A&M University.
Beven K.J., Kirkby M.J. (1979). A physically based, variable contributing area model of basin hydrology. Hydrological Sciences Bulletin, 24(1), 43–69.
FAO, IIASA, ISRIC, ISSCAS, & JRC. (2012). Harmonized World Soil Database (version 1.2). Food and Agriculture Organization of the United Nations. https://www.fao.org/soils-portal/data-hub/soil-maps-and-databases/harmonized-world-soil-database-v12/en/.
Gassman, P.W., Reyes, M.R., Green, C.H., Arnold, J.G. (2007). The Soil and Water Assessment Tool: Historical Development, Applications, and Future Research Directions. Transactions of the ASABE, 50(4), 1211–1250. https://doi.org/10.13031/2013.23637.
Grabs, T., Seibert, J., Bishop, K., Laudon, H. (2009). A comparison of the topographic wetness index and model-derived indices. Journal of Hydrology 373(1-2):15-23. https://10.1016/j.jhydrol.2009.03.031.
Mioduszewski, W., & Okruszko, T. (2016). Natural, small-scale water retention – A method for mitigating the effects of drought, reducing flood risk and protecting biodiversity. Methodological Foundations. ISBN: 978-83-944813-0-8.
Texas A&M University. (n.d.). SWAT: Soil & Water Assessment Tool. Retrieved from https://swat.tamu.edu/