
Urban Agriculture: crop production in cities as an example of provisioning ecosystem services
Agricultural production in urban areas in Poland is playing an increasingly important role, particularly in the context of sustainable development, food security and improving the quality of life for city dwellers. Although agriculture is traditionally associated with rural areas, there has been a marked increase in interest in urban forms of crop and livestock farming in recent years. This trend can also be observed in scientific and planning literature (Sroka, Król, Matysik-Pejas, 2021).
Urban agriculture includes, amongst other things, allotments, community gardens, home gardens, green roofs, as well as modern forms such as vertical and hydroponic farms. In Polish towns and cities, allotment gardens have a long tradition and remain an important source of fresh fruit and vegetables for many families. They also serve a social and recreational purpose, fostering the integration of local communities and promoting active leisure (Fig. 1).
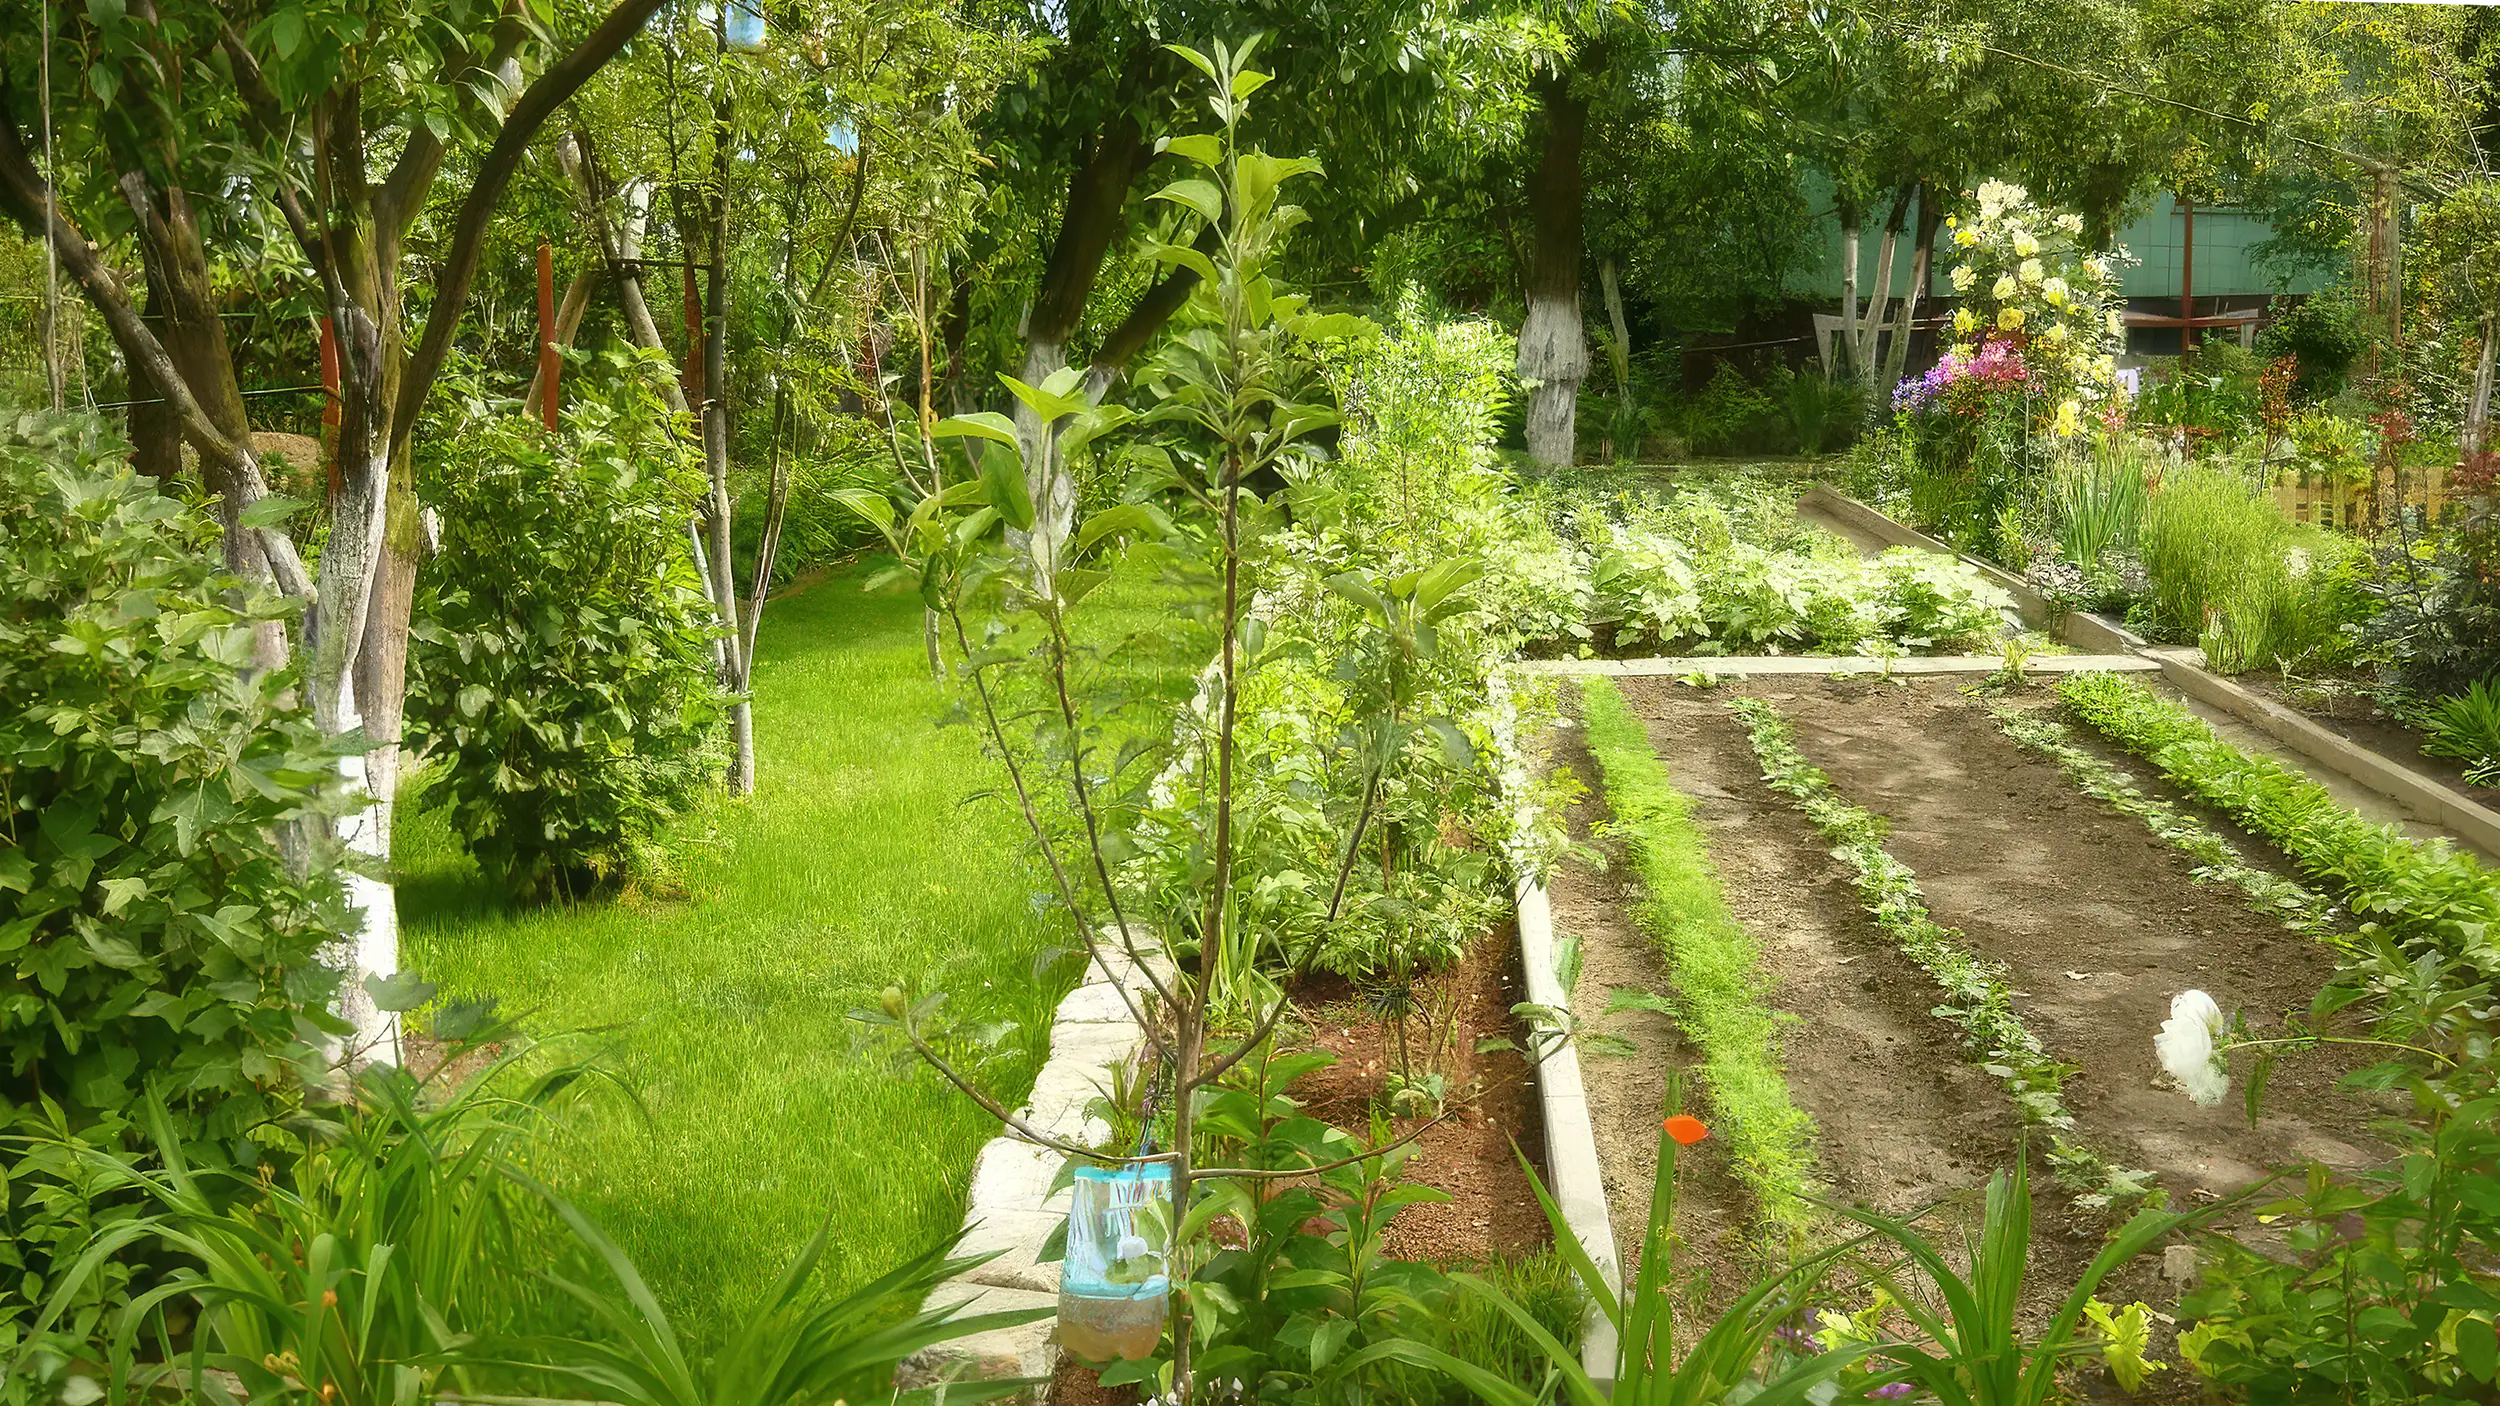
Fig. 1. Crops grown in allotment gardens. Source: Polish Allotment Gardeners’ Association, Pomeranian District in Gdańsk.
Urban farming helps to shorten food supply chains, thereby reducing transport costs and greenhouse gas emissions. Local food production increases cities’ resilience to crises such as supply disruptions or sudden price spikes. Furthermore, the presence of green spaces and crops has a positive impact on the urban microclimate, improves water retention and reduces the urban heat island effect.
The educational aspect is also significant. Urban agriculture enables residents, particularly children and young people, to gain a better understanding of food production processes and the importance of environmental protection. As a result, agricultural production in urban areas in Poland is becoming an important element of modern urban policy, combining economic, social and environmental functions.
1. Scope of the research
The study focuses on Functional Urban Areas (FUAs) in the Lubuskie Province.
1.1. Functional Urban Areas
The concept of Functional Urban Areas (FUAs) refers to areas that extend beyond the administrative boundaries of cities, encompassing both the urban core and the associated suburban areas. The key criterion for defining an FUA is actual functional links, such as commuting, flows of people, services, capital or infrastructure, rather than the formal boundaries of local government units. In Poland, this concept is widely used in strategic planning, regional policy and territorial development programming.
Functional Urban Areas are part of the EU’s territorial typologies, which constitute a grouping of the statistical territorial units of the European Union’s Member States. These have been used by Eurostat for many years to meet the growing demand for internationally comparable data in the context of cohesion policy and territorial development.

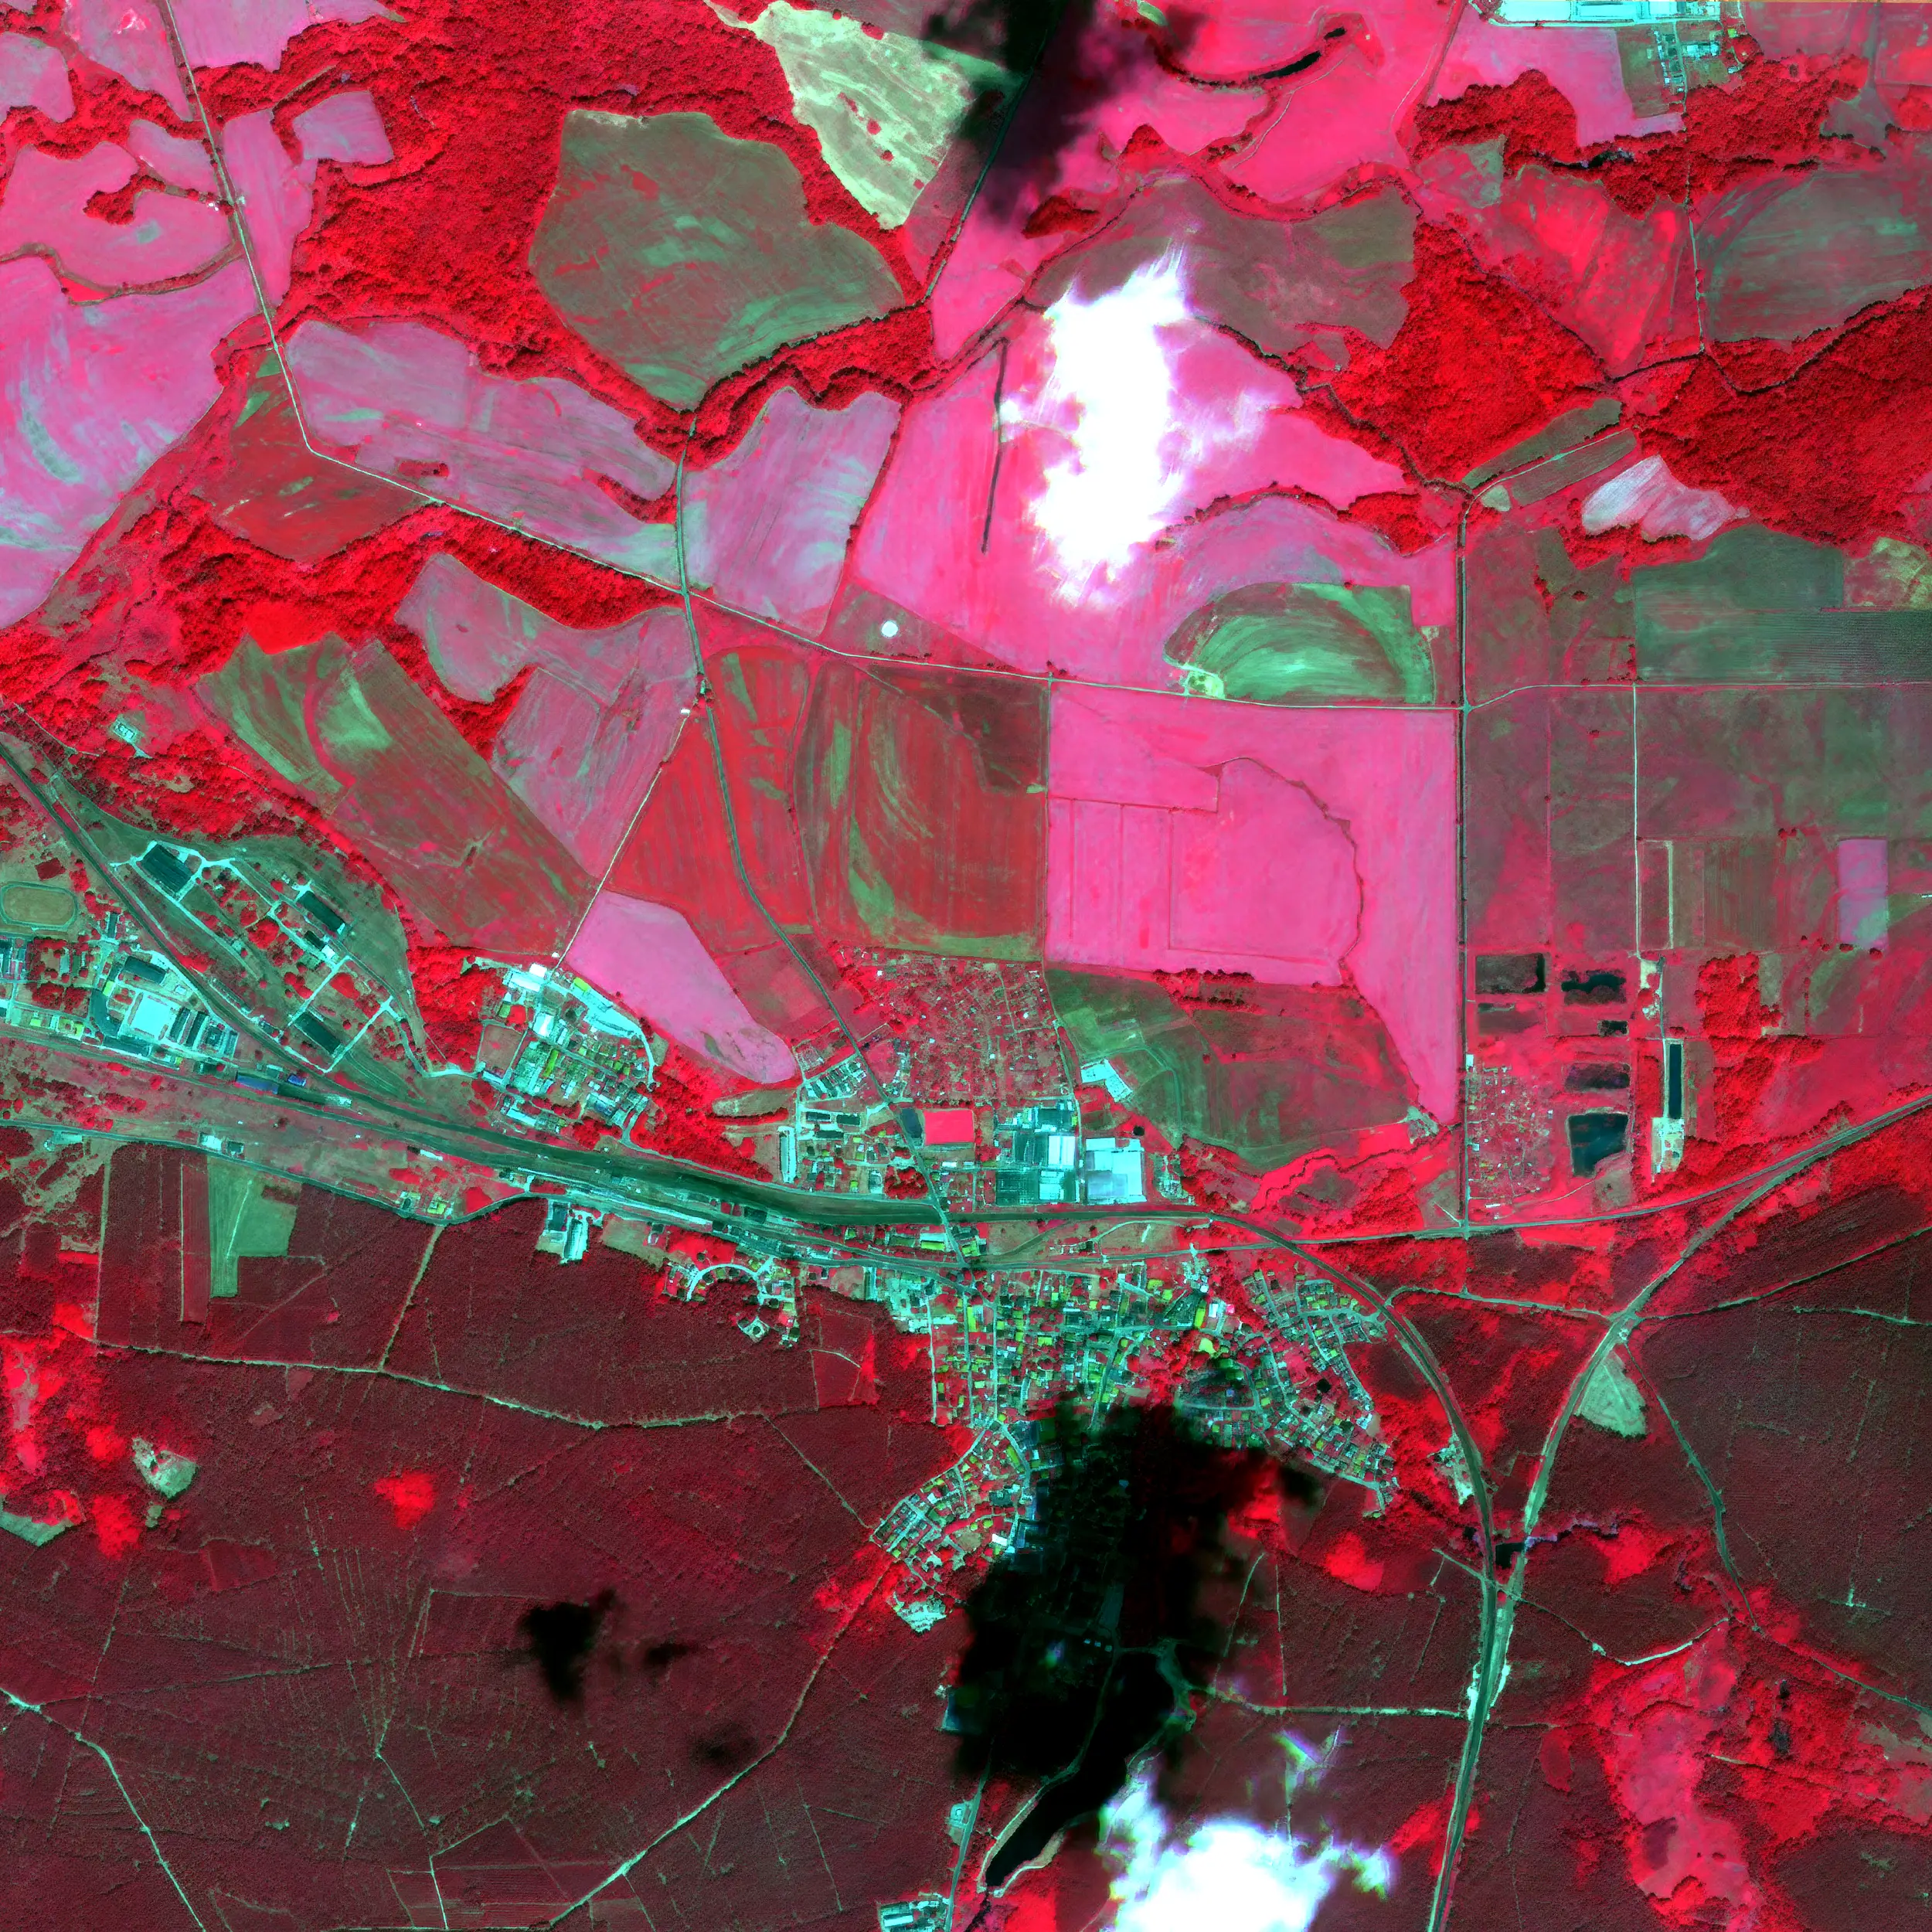
FUA are characterised by significant spatial and functional diversity. They encompass densely built-up city centres, residential areas, industrial zones, as well as open spaces, including agricultural land and natural areas. In this context, agricultural production plays a significant, though often underestimated, role, particularly in suburban areas where there is intense competition for space between urban and agricultural functions (Fig. 2).
1.2. Functional Urban Areas in the Lubuskie Province
There are two FUA offices in the Lubuskie Province: the Zielona Góra FUA (55) and the Gorzów Wielkopolski FUA (14). Their respective areas cover:
- Zielona Góra, a city with county status,
- The municipality of Czerwieńsk,
- The municipality of Świdnica,
- The municipality of Otyń,
- The municipality of Nowogród Bobrzański,
- The municipality of Zabór,
- The municipality of Brzeźnica,
- The municipality of Dąbie.
and:
- Gorzów Wielkopolski, a town with county rights,
- The municipality of Kłodawa,
- The municipality of Lubiszyn,
- The municipality of Santok,
- The municipality of Deszczno,
- The municipality of Bogdaniec,
- The municipality of Zwierzyn.
2. Research objectives and methodology
The aim of the study is to calculate the area of agricultural land used for crop production per capita. To obtain this information, Sentinel-2 satellite imagery provided by the European Space Agency (ESA) as part of the Copernicus programme was used.
2.1. Quantification of areas actually used for crop production
The quantification of areas actually used for production purposes is based on the difference between the digital land cover model and the digital elevation model (Zhao et al., 2015), and the mixLAI index (Sentinel Hub, n.d.) calculated using Sentinel-2 satellite imagery obtained from the Copernicus programme. Using the formula 1-e^(-0.5*mixLAI), the vegetation density in a given area is determined; this is then multiplied by the canopy height obtained from the difference between NMPT and NMT to obtain the estimated crop volume.
2.2. Identification of crop production areas
Detection is based on information obtained from multispectral satellite imagery and other sources, such as plot boundaries from the BDOT10K database (Database of Topographic Features at a scale of 1:10,000) or Urban Atlas layers such as Street Tree, which contain information on tree canopy cover.
2.3. Spectral indices used to detect plant growth
Using existing formulas for spectral indices makes it possible to highlight areas of interest with the help of appropriate indices. These include:
NDVI (Normalised Difference Vegetation Index) – which is used to assess plant health and density using the NIR (Near-Infrared) and red bands,
MSAVI (Modified Soil Adjusted Vegetation Index) – a spectral index which, like the NDVI, is used to assess plant condition using the same spectral bands, but its distinguishing feature is that it automatically adjusts the index value to account for the soil background. (Qi et al., 1994),
BI and BI2 (Brightness Index and Second Brightness Index) are two indices that can be used to determine the amount of salt and water in the soil, as well as biomass. (Gojiya et al., 2023).
2.4. Additional data sources
Additional data sources were used to provide further context regarding the use of the area, including:
- BDOT10K – the database used to compile the boundaries of plots and their land use, as well as the buildings and building types on each plot,
- the Urban Atlas Street Tree Layer – which contains information on tree cover within the area against a background of ‘artificial surfaces’,
- Orthophotos – in complex cases, high-resolution multi-temporal orthophotos were used to provide historical context regarding the actual land use of a given area.
3. Upscaling of Sentinel-2 data
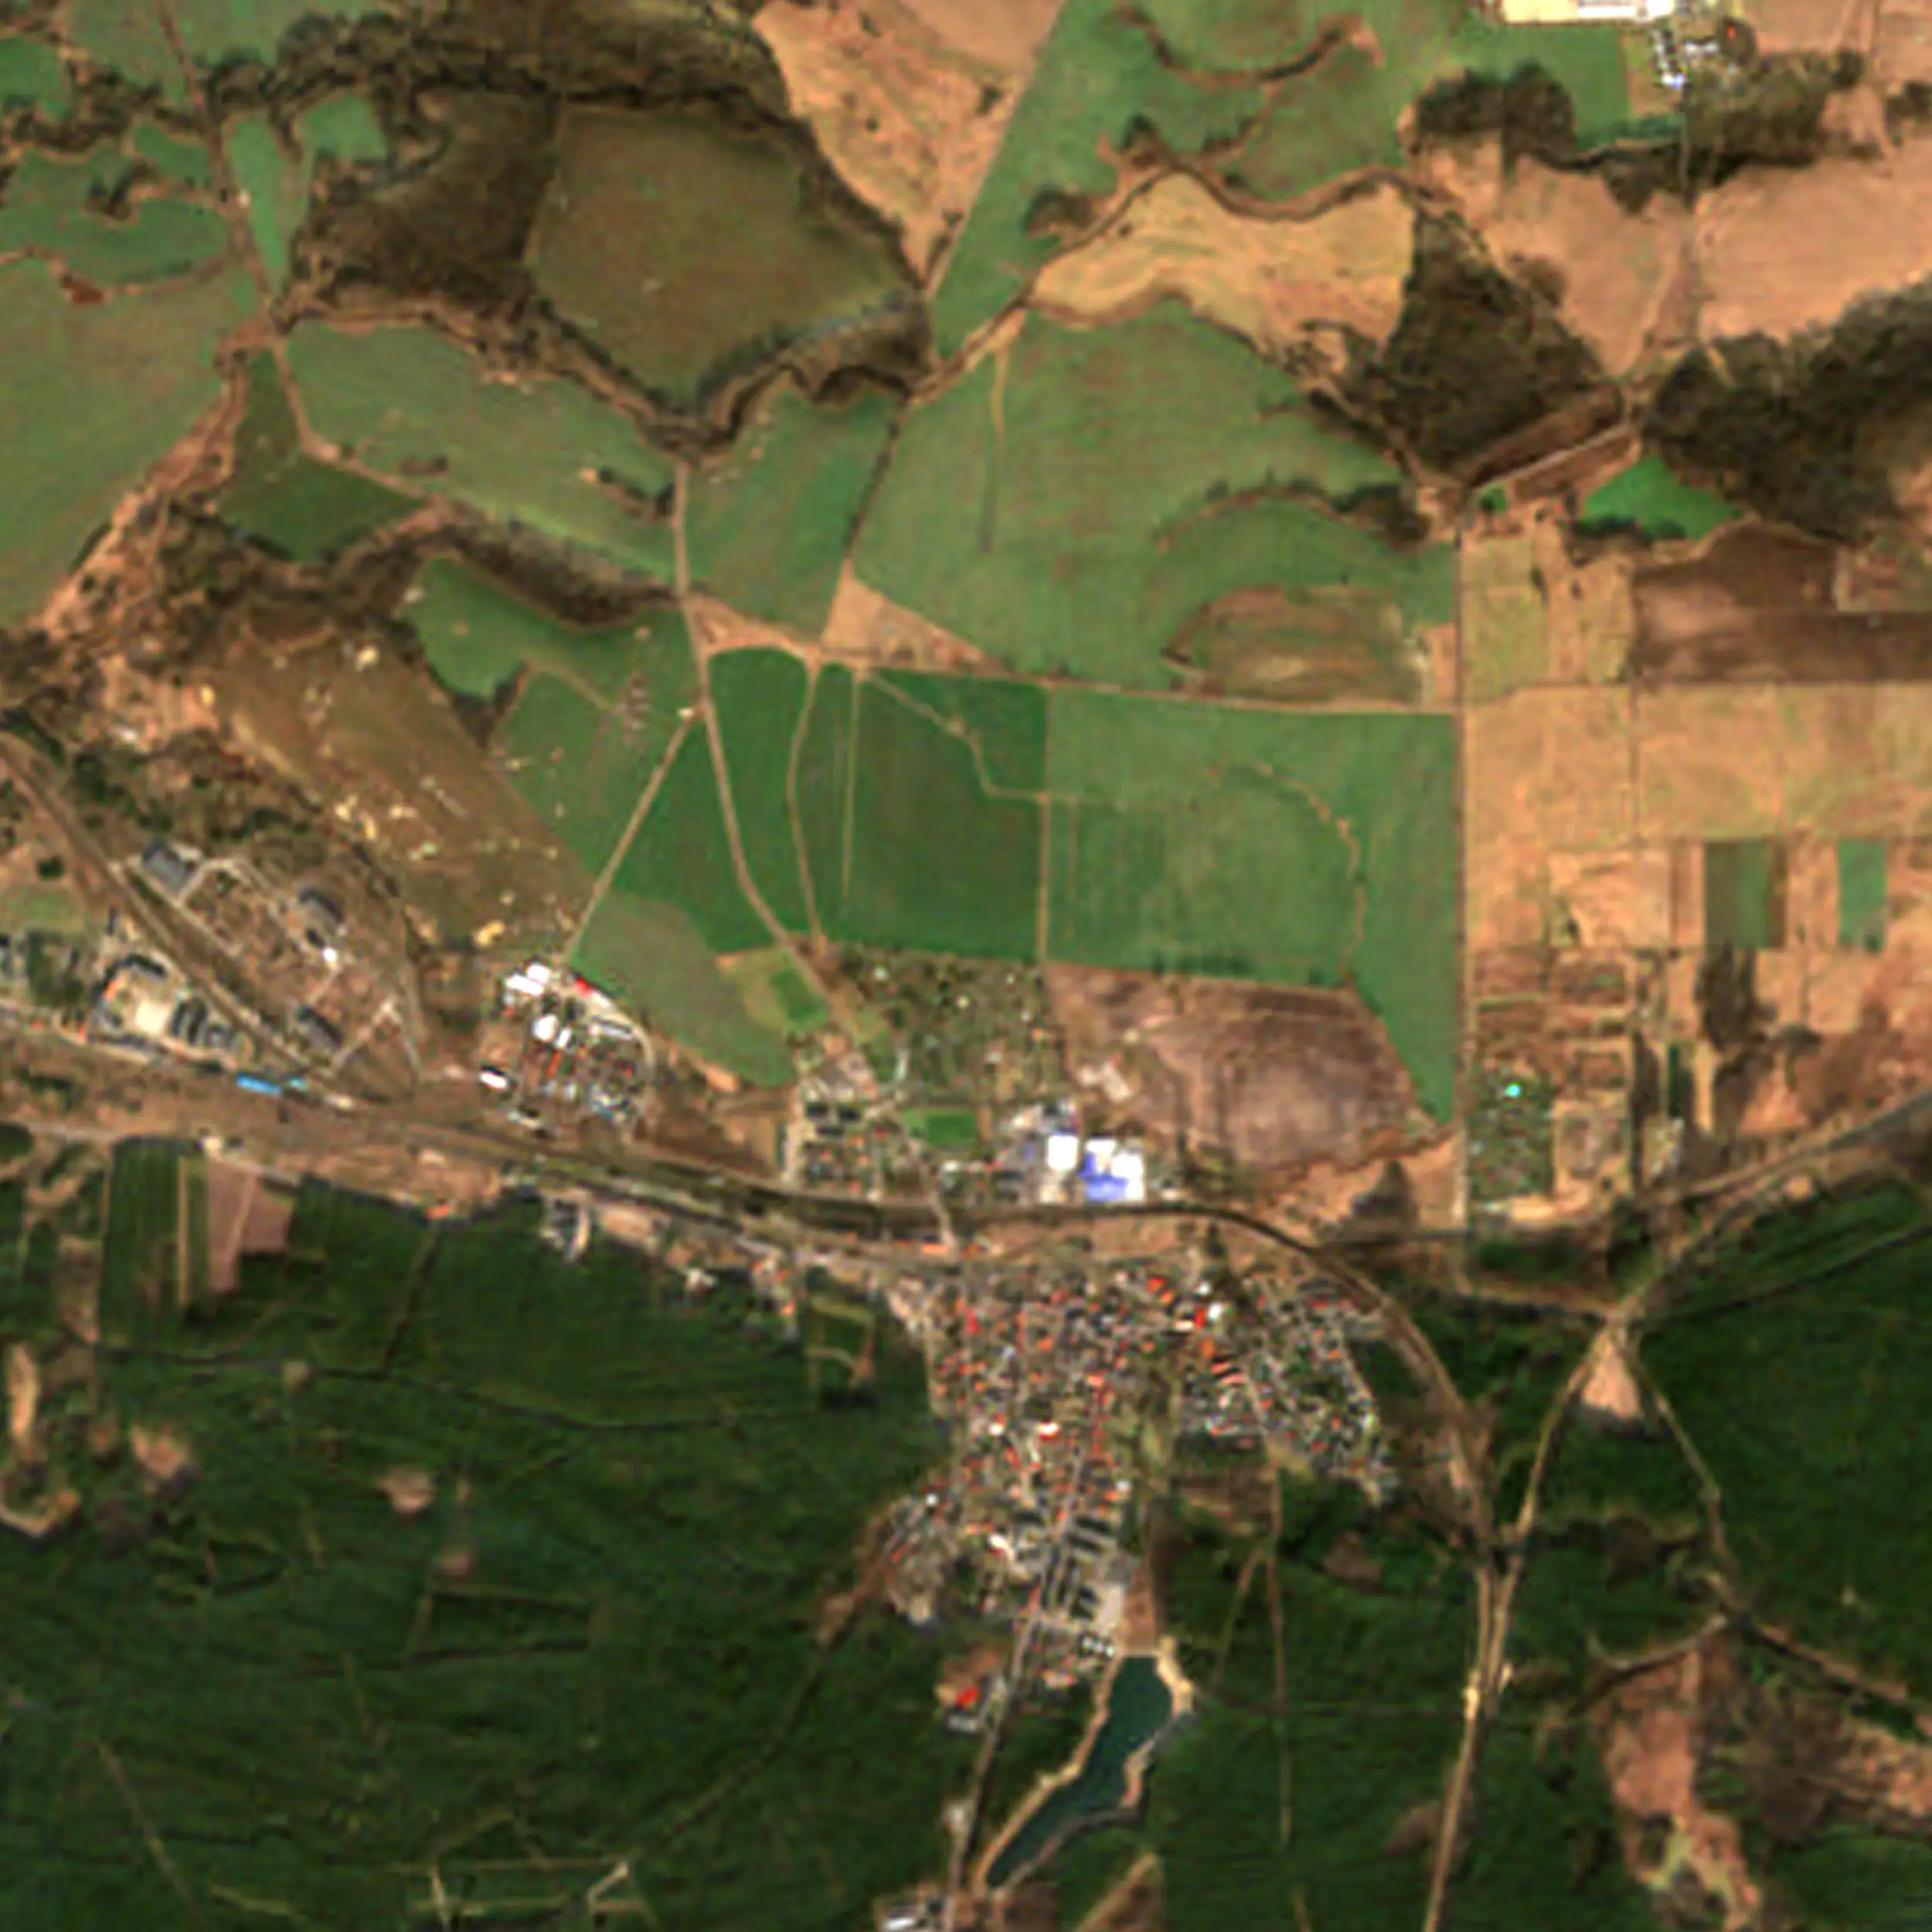
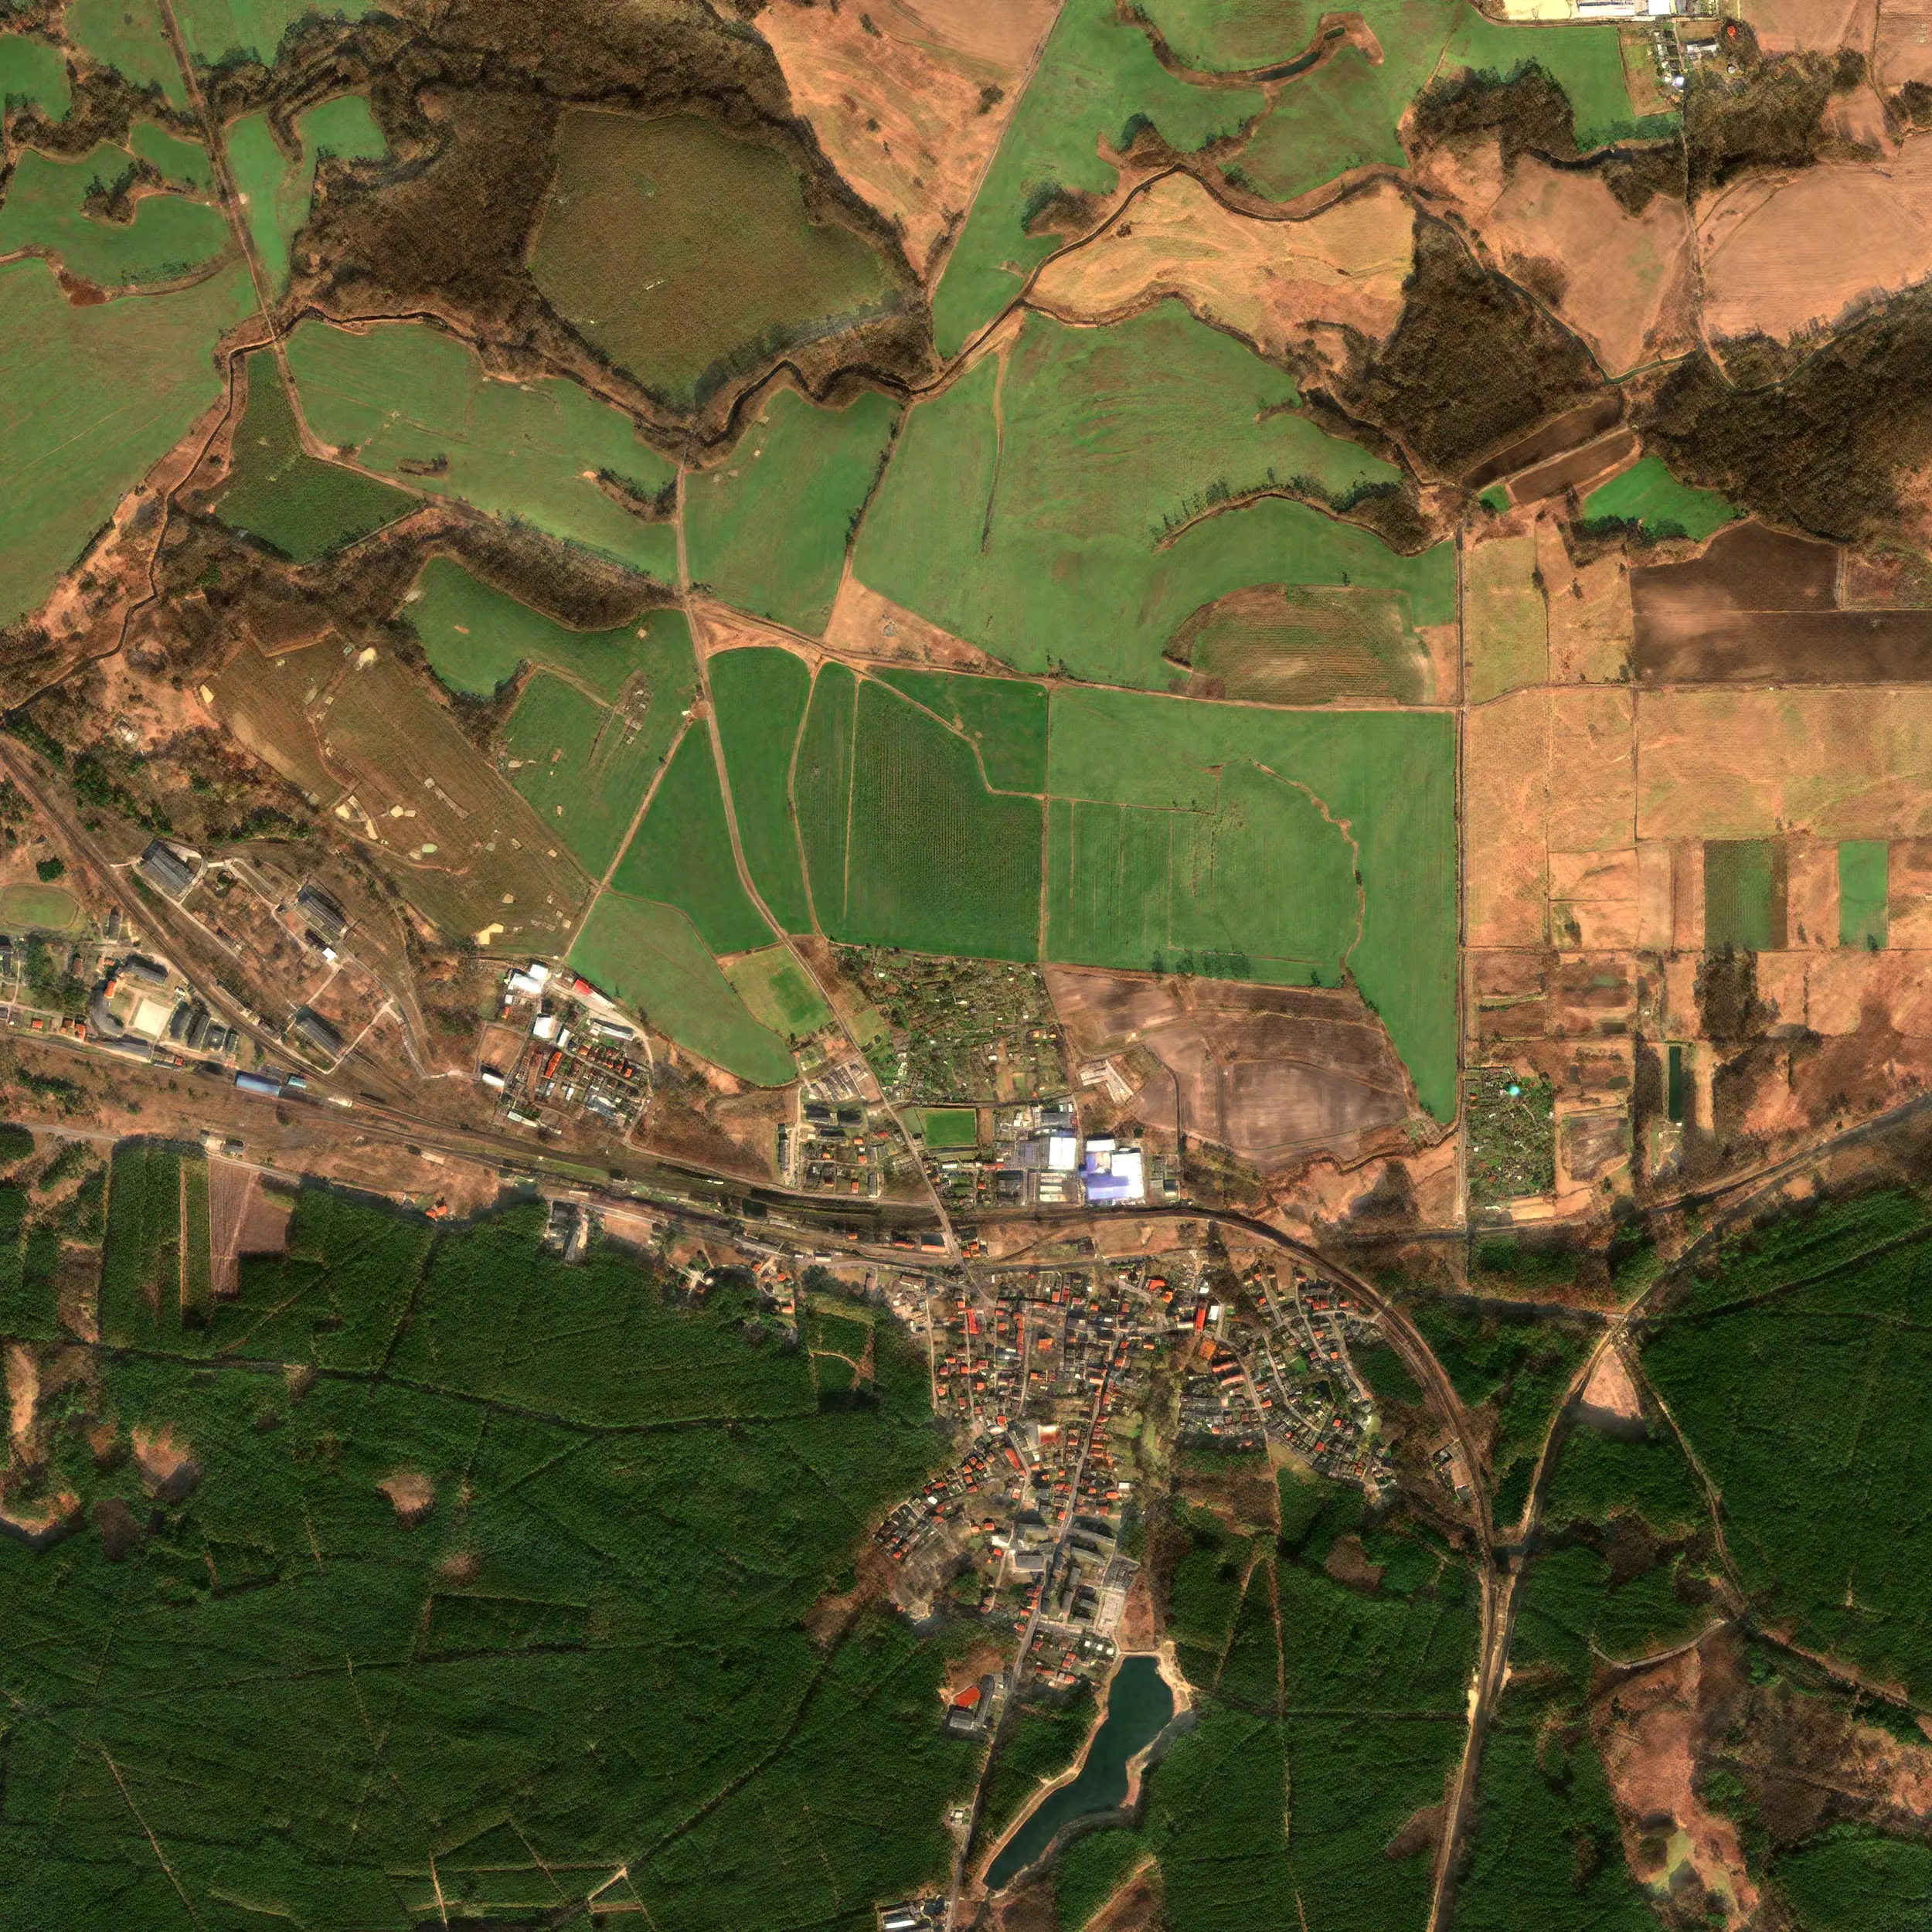
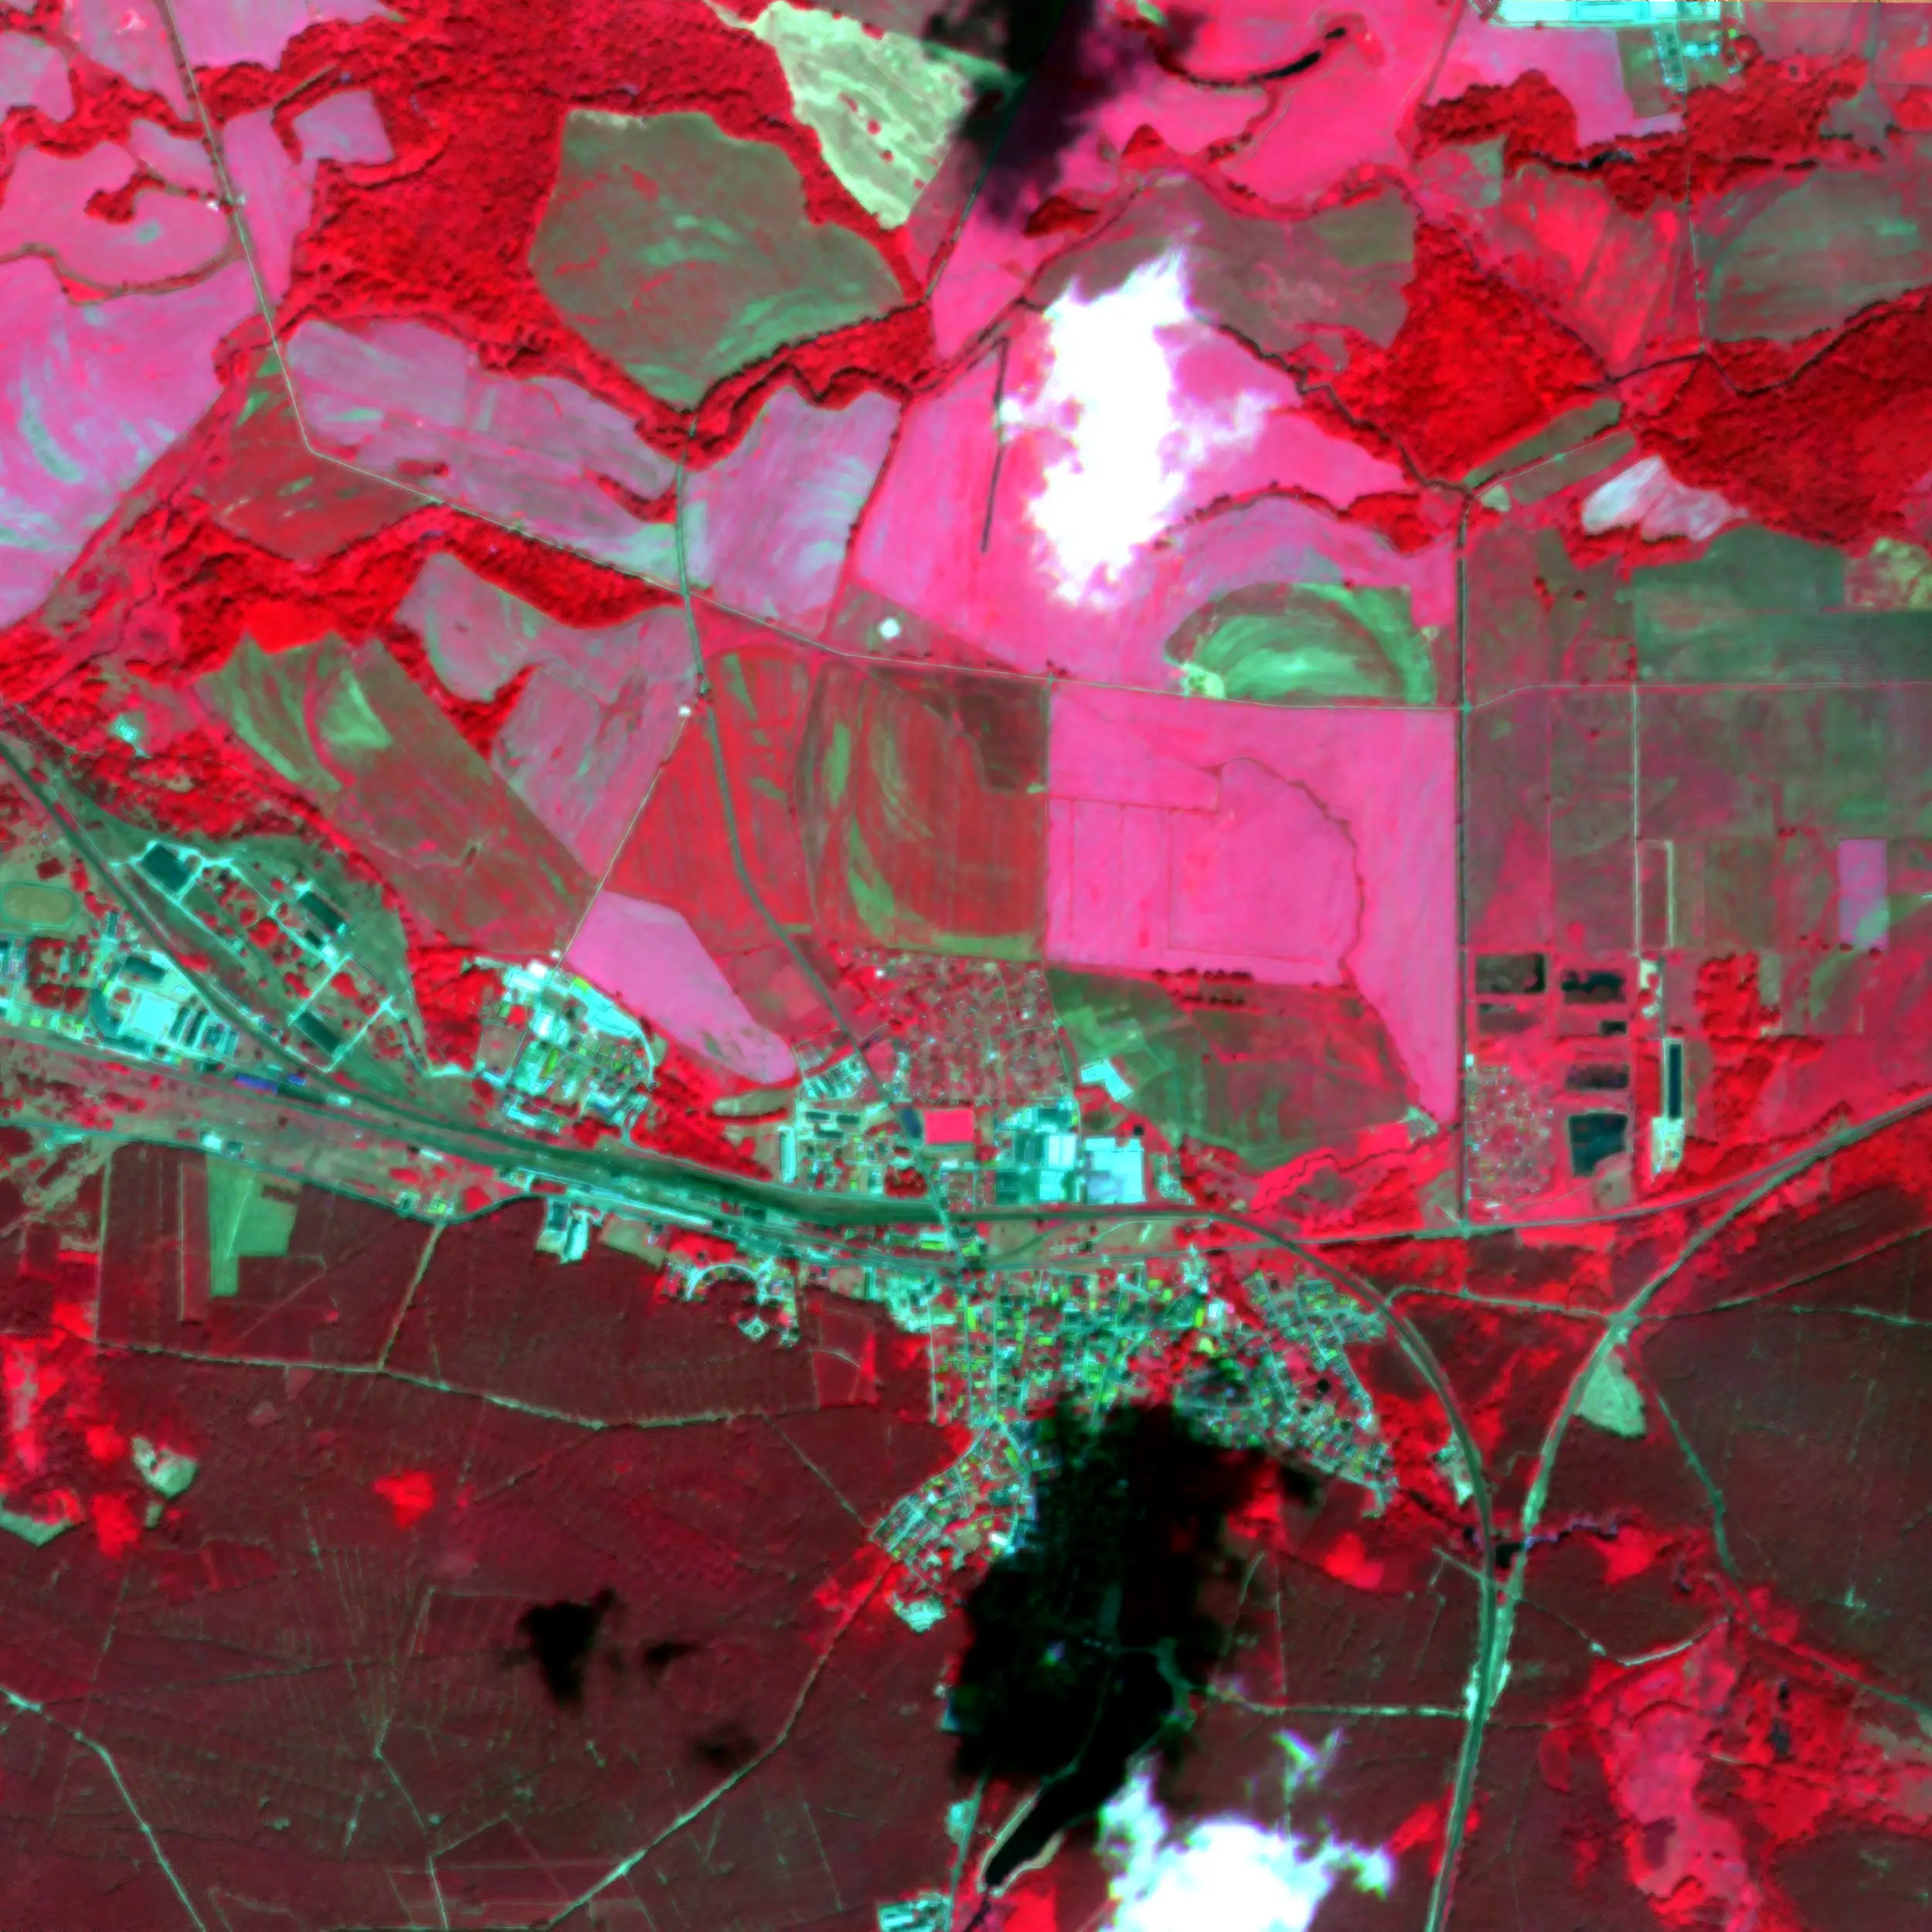
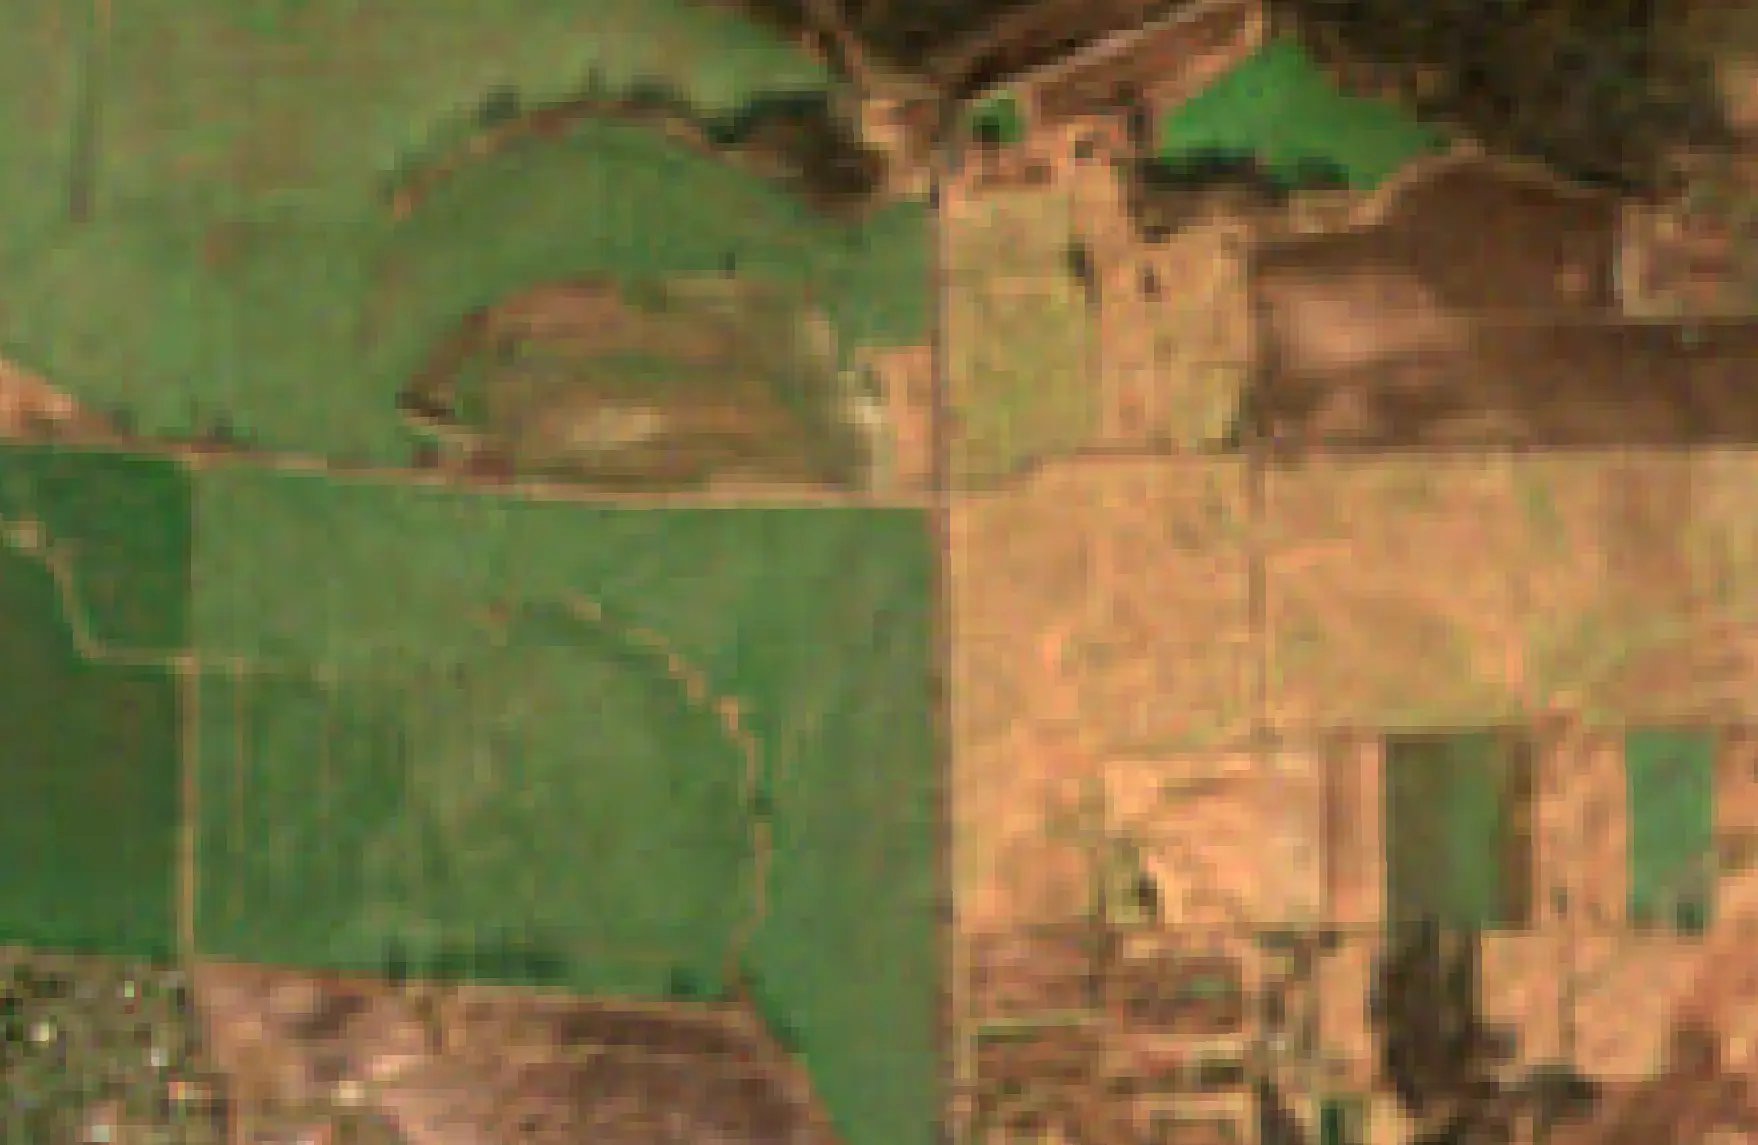
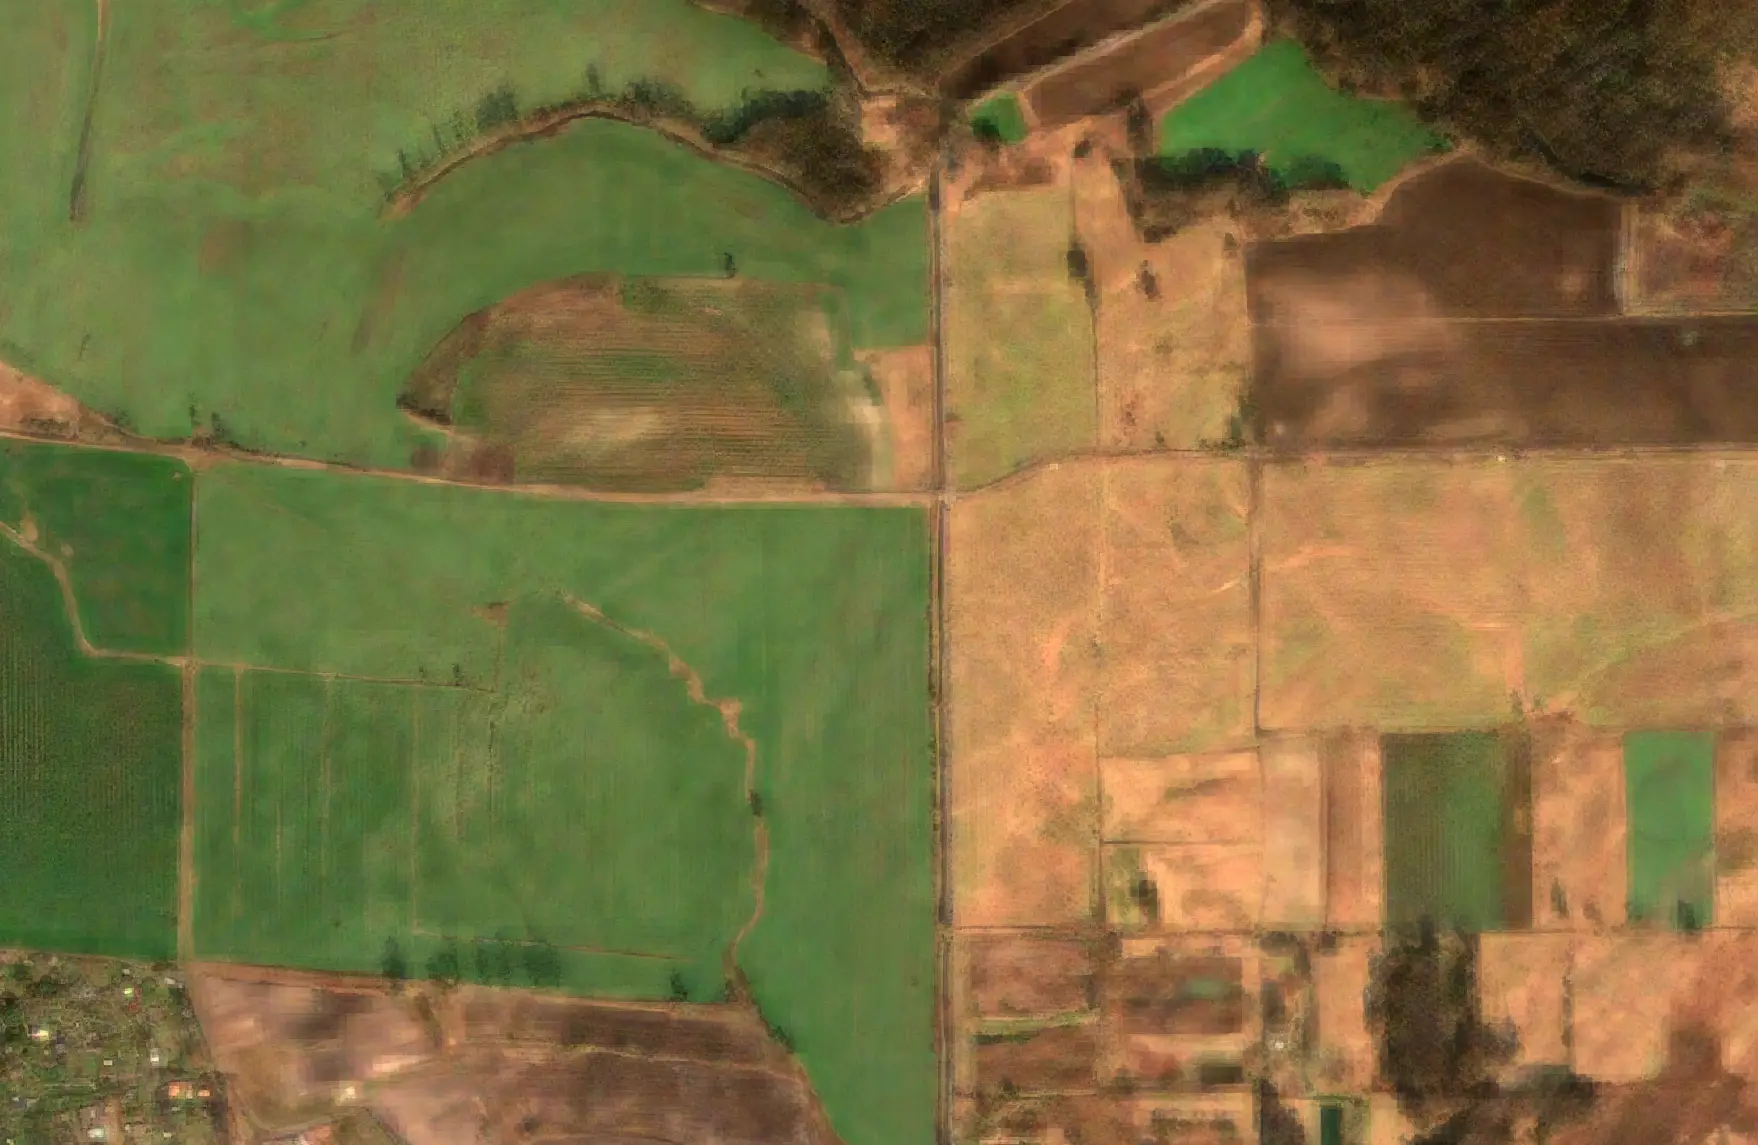
For the area of cities with county status, an innovative upscaling technique was employed, which enabled the resolution of satellite imagery to be increased from 10 metres per pixel to 1 metre per pixel across all bands used. A comparison of RGB and CIR image samples before and after upscaling is shown in Figure 3.
3.1. Upscaling using the S2DR3 model
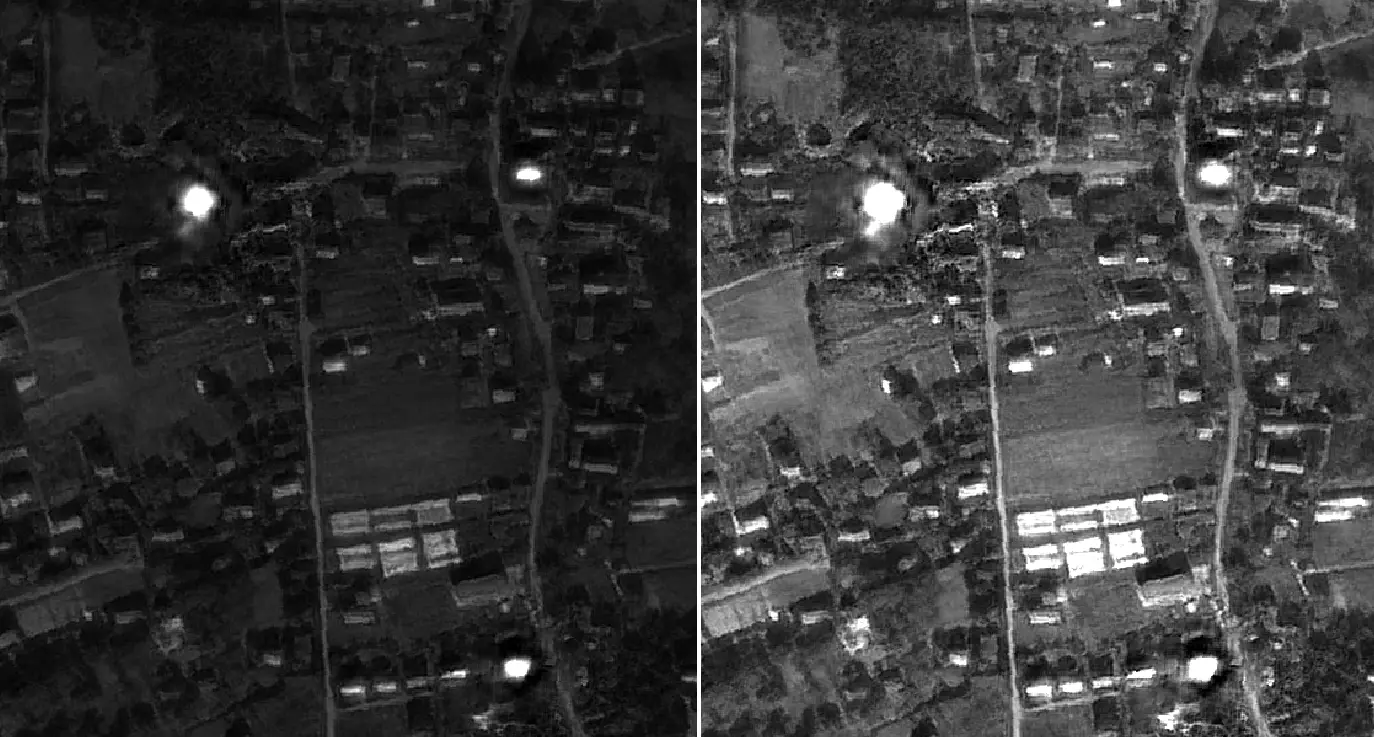
The S2DR3 (Sentinel-2 Deep Resolution 3) model was used for upscaling; it is designed to enhance the detail of Sentinel-2 multispectral satellite images from a resolution of 10–20 m to a level approaching 1 m/pixel. The model uses deep neural networks to analyse the relationships between spectral bands, such as RGB, NIR (Near-Infrared) and SWIR (Short-Wave Infrared), and then reconstructs more detailed terrain features, sharpening the boundaries of fields, roads and buildings. Instead of simple interpolation, S2DR3 predicts missing details based on patterns learned during training on high-resolution reference data. The result is not a true 1-metre image from the satellite sensor, but an intelligently reconstructed version with significantly better readability and usefulness in GIS analyses using satellite data (Fig. 4).
3.2. Reducing errors caused by upscaling artefacts
As a result of upscaling, certain pixel values for specific bands were exaggerated, which led to errors in the calculations and distorted the visualisations and final results. During the normalisation of the upscaling results, outliers were identified and reduced, enabling a more effective analysis.
3.3. The remaining part of the Functional Urban Areas
The remaining area of the FUA was surveyed using satellite imagery with an original resolution of 10 metres.
4. Results
The quantification of areas actually used for production purposes is based on the difference between the digital land cover model and the digital elevation model, with the mixLAI index calculated using Sentinel-2 satellite imagery obtained from the Copernicus programme. Using the formula 1 – e^(-0.5*mixLAI), the vegetation density in a given area is determined; this is then multiplied by the canopy height obtained from the difference between NMPT and NMT to obtain the estimated crop volume.
4.1. Result for FUA Gorzów Wielkopolski (S2DR3)
For the Gorzów Wielkopolski FUA area, taking into account the error resulting from upscaling, the following results were obtained:
- 256.7–257.6 km² in February 2025
- 274.4–276.7 km² in June 2025
4.2. Result for FUA Zielona Góra (S2DR3)
For the Zielona Góra FUA area, taking into account the error resulting from upscaling, the following results were obtained:
- 63–69.8 km² in February 2025
- 245.2–249.3 km² in June 2025
4.3. Summary of results for local authorities
The crop survey results presented in the tables below are based on Sentinel-2 data at its original resolution of 10 metres per pixel, to make it easier for end users to interpret the results.
| FUA ZIELONA GÓRA | |||||||||
| Area | number of people | foliar area [m²] | per person | crop volume [m³] | per person | ||||
| February | June | February | June | February | June | February | June | ||
| Brzeźnica | 3420 | 93,330.62 | 612,275.03 | 6.56 | 27.29 | 230,567.77 | 342,379.48 | 67.42 | 100.11 |
| Czerwieńsk | 10143 | 78,652.69 | 461,741.88 | 5.87 | 7.75 | 167,911.83 | 218,635.53 | 16.55 | 21.56 |
| Dąbie | 4936 | 71,154.26 | 387,907.20 | 5.45 | 14.42 | 150,542.47 | 186,148.74 | 30.50 | 37.71 |
| Novogrudok | 8811 | 69,063.18 | 385,047.07 | 5.58 | 7.84 | 244,539.47 | 315,254.90 | 27.75 | 35.78 |
| Otyń | 7162 | 45,787.83 | 264,070.90 | 5.77 | 6.39 | 64,455.00 | 86,899.00 | 9.00 | 12, 13 |
| Świdnica | 6911 | 42,466.92 | 218,672.52 | 5.15 | 6.14 | 133,179.24 | 161,667.64 | 19.27 | 23.39 |
| The Partition | 4852 | 24,542.66 | 146,873.54 | 5.98 | 5.06 | 101,719.85 | 12,358.79 | 20.96 | 2.55 |
| Zielona Góra | 138760 | 46,413.53 | 268,733.39 | 5.79 | 0.33 | 130,654.99 | 185,916.71 | 0.94 | 1.34 |
| summary | 184995 | 471,411.69 | 2,745,321.54 | 5.82 | 2.55 | 1,223,570.63 | 1,498,370.74 | 6.61 | 8.16 |
| FUA GORZÓW WIELKOPOLSKI | |||||||||
| Area | number of people | foliar area [m²] | per person | crop volume [m³] | per person | ||||
| February | June | February | June | February | June | February | June | ||
| Bogdaniec | 7160 | 527,668.12 | 615,027.77 | 73.70 | 85.90 | 108,621.35 | 124,632.84 | 15.17 | 17.41 |
| It’s rainy | 11165 | 394,623.95 | 425,947.86 | 35.34 | 38.15 | 90,101.69 | 95,644.49 | 8.07 | 8.57 |
| Gorzów Wielkopolski | 114076 | 100,276.83 | 89,818.59 | 0.88 | 0.79 | 20,812.49 | 19,190.22 | 0.18 | 0.17 |
| Kłodawa | 9486 | 244,491.33 | 283,030.54 | 25.77 | 29.84 | 99,870.65 | 115,759.22 | 10.53 | 12.20 |
| Lubiszyn | 7196 | 468,540.94 | 498,456.39 | 65.11 | 69.27 | 287,646.49 | 312,570.38 | 39.97 | 43.44 |
| Santok | 9761 | 474,125.10 | 585,189.46 | 48.57 | 59.95 | 161,866.07 | 184,203.67 | 16.58 | 18.87 |
| Wildlife | 4102 | 498,150.98 | 580,126.82 | 121.44 | 141.43 | 107,877.95 | 119,959.66 | 26.30 | 29.24 |
| summary | 162946 | 2,707,877.25 | 3,077,597.44 | 16.62 | 18.89 | 876,796.70 | 971,960.47 | 5.38 | 5.96 |
4.4. Interpretation of results
The analysis carried out made it possible to estimate the production potential of agriculturally used land within the functional urban areas (FUAs) of Zielona Góra and Gorzów Wielkopolski. The model utilises information on vegetation structure and density derived from Sentinel-2 data, as well as vegetation height determined based on the difference between the digital surface model (DSM) and the digital elevation model (DEM). The resulting crop volume serves as an indicator of potential productive biomass and allows for a comparison of the production capacity of individual areas; however, it is highly illustrative, as due to a lack of data on ground cover height for the given period, data collected during the summer months were used.
The analysis, carried out for two dates – February and June 2025 – enables an assessment of the impact of seasonality on the biological activity of vegetation and the productive potential of agricultural land.
4.5. Comparison of FUA areas
In the case of the Gorzów Wielkopolski FUA, the area of land actively used for production increased from approximately 257 km² in February to approximately 276 km² in June 2025, representing an increase of around 7%. This indicates a relatively stable pattern of land use and a high proportion of land remaining in active use for most of the year.
A much more significant increase was observed for the Zielona Góra FUA. The production area rose from around 66 km² in February to around 247 km² in June, representing an increase of over 270%. Such a large difference points to the strong influence of the growing season and the predominance of crops that develop during the spring and summer months.
In terms of total harvest volume, both areas showed an increase between the periods analysed. For the Zielona Góra FUA, the volume of crops increased from 1.22 million m³ to nearly 1.50 million m³, whilst for the Gorzów Wielkopolski FUA it rose from 0.88 million m³ to 0.97 million m³. This represents an increase of approximately 22% and 11% respectively.
4.6. Per capita production
The per capita crop volume indicator allows us to assess the relationship between production potential and the population living in a given area.
For FUA Zielona Góra, the index rose from 6.61 m³/person in February to 8.16 m³/person in June. This represents an increase of around 23%, indicating a significant rise in the availability of production resources during the peak growing season.
In the case of the Gorzów Wielkopolski FUA, the figure rose from 5.38 m³ per capita to 5.96 m³ per capita, an increase of around 11%. Despite the larger total production area in the Gorzów region, the production potential per capita remains lower than in the Zielona Góra FUA.
The results suggest that the Zielona Góra Urban Area is characterised by a more favourable ratio between productive resources and population size, which may translate into greater food self-sufficiency and greater potential for the development of local agricultural production.
4.7. Spatial variation within the Zielona Góra FUA
The highest figures for the volume of crops per capita were recorded in the municipality of Brzeźnica, where the figure reached 67.42 m³/capita in February and 100.11 m³/capita in June. High figures were also recorded for the municipalities of Dąbie (37.71 m³/cap.) and Nowogród Bobrzański (35.78 m³/cap.).
The lowest figures were recorded in the city of Zielona Góra, where the figures stood at 0.94 m³ per person and 1.34 m³ per person respectively. This is primarily due to the high number of residents per unit of industrial land area.
In most municipalities, a marked increase in production capacity was recorded between February and June, confirming the strong seasonality of agricultural production in the Zielona Góra FUA.
The exception is the municipality of Zabór, where the volume of crops fell from 101,700 m³ to 12,400 m³. This may be due to the specific nature of the land-use structure, changes in land cover between imaging dates, or may require further verification of the input data.
4.8. Spatial variation within the Gorzów Wielkopolski FUA
Within the Gorzów Wielkopolski FUA, the highest per capita production potential was recorded in the municipality of Lubiszyn, where the figure rose from 39.97 m³/capita to 43.44 m³/capita. High figures were also recorded in the municipalities of Zwierzyn (29.24 m³/capita) and Santok (18.87 m³/capita).
The lowest figures were recorded in the town of Gorzów Wielkopolski, where the indicator stood at around 0.18 m³ per person. This is due to the predominance of urban functions and a high population density, coupled with a small proportion of industrial land.
In contrast to the Zielona Góra FUA, the changes between February and June were relatively minor and mainly concerned an increase in the intensity of production on existing agricultural land. This points to a more stable pattern of land use and less seasonal variation in vegetation activity.
4.9. Conclusions
The analysis carried out indicates that both functional urban areas possess significant production potential, but are characterised by different seasonal dynamics. The Zielona Góra FUA shows much greater variations between the winter and summer periods, which indicates a strong dependence on the growing season. The Gorzów Wielkopolski FUA, on the other hand, is characterised by greater spatial stability and lower seasonal variability.
In terms of production potential per capita, the most favourable figures were recorded for the Zielona Góra Functional Urban Area (FUA), particularly during the growing season. The highest production potential relative to population size is found in rural municipalities with low population density, whilst the lowest figures are observed in the main urban centres of both functional areas.
Bibliography
Akhtman, Y. (2023). Sentinel-2 Deep Resolution 3.0 (S2DR3): Effective 12-band 10x single-image super-resolution for Sentinel-2. Medium. https://medium.com/@ya_71389/sentinel-2-deep-resolution-3-0-c71a601a2253
Gojiya, K., Rank, H., Chauhan, P., Patel, D., Satasiya, R. M., & Prajapati, G. (2023). Remote sensing and GIS applications in soil salinity analysis: A comprehensive review. International Journal of Environment and Climate Change, 13, 2149–2161. https://doi.org/10.9734/IJECC/2023/v13i113377
Qi, J., Chehbouni, A., Huete, A., Kerr, Y., & Sorooshian, S. (1994). A modified soil-adjusted vegetation index. Remote Sensing of Environment, 48, 119–126. https://doi.org/10.1016/0034-4257(94)90134-1
Sroka W., Król K., Matysik-Pejas R. (2021). Urban agriculture in global and Polish literature and in the planning documents of selected Polish cities, Wieś i Rolnictwo 3 (192) ISSN 0137-1673 https://doi.org/10.53098/wir032021/03.
Sentinel Hub. (n.d.). Mix Leaf Area Index (MixLAI). Retrieved from https://custom-scripts.sentinel-hub.com/custom-scripts/sentinel-2/mixlai/
Zhao, K., García, M., Liu, S., Guo, Q., Chen, G., Zhang, X., Zhou, Y., & Meng, X. (2015). Terrestrial lidar remote sensing of forests: Maximum likelihood estimates of canopy profile, leaf area index, and leaf angle distribution. Agricultural and Forest Meteorology, 209–210, 100–113. https://doi.org/10.1016/j.agrformet.2015.03.008