Reducing air pollution as an example of regulating ecosystem services
This paper presents a proposed method for identifying areas characterised by elevated concentrations of air pollutants, using nitrogen dioxide (NO₂) in the Lubuskie Province as an example. The identification of zones with the highest concentration levels is of significant importance from the perspective of environmental management and spatial planning. It enables local authorities to take measures aimed at reducing pollutant emissions and minimising their negative impact on residents’ health and the functioning of the natural environment.
The analyses focus on the areas of Zielona Góra and Gorzów Wielkopolski, their functional urban areas (FUAs), and landscape units used as the primary aggregation level in the assessment of ecosystem services. The study covers data for the year 2024, and maps of the spatial distribution of NO₂ concentrations were generated using a hexagonal grid. A grid with a resolution of 7 was used for the functional urban areas, whilst a more detailed grid with a resolution of 9 was used for the urban areas of Zielona Góra and Gorzów Wielkopolski. This approach made it possible to capture the spatial variation in pollutant concentrations at both regional and local scales.
The chosen level of aggregation allows for an analysis of the relationship between the degree of urbanisation, land use, and the environment’s potential to provide ecosystem services. The method used aims not only to identify areas particularly vulnerable to high concentrations of NO₂, but also to lay the groundwork for further analyses related to air quality assessment and the support of environmental and transport policies at local and regional levels.
1. Air pollution
Air pollution is one of the most serious environmental problems facing the modern world. Increasing urbanisation, industrialisation and the rapid growth of road transport have contributed to a rise in emissions of harmful substances into the atmosphere (Swain, 2024). These pollutants can be either gaseous or particulate in nature, and their source is mainly human activity: the burning of fossil fuels, industrial production, agriculture and the heating of buildings. Depending on atmospheric conditions and terrain, the concentration of these substances can vary significantly over time and space.
Pollution is particularly problematic in large cities and industrial areas, where emission levels far exceed the environment’s capacity to neutralise them (Ballschmiter, 1992). The most common air pollutants include sulphur oxides (SO₂), nitrogen oxides (NOₓ), carbon monoxide (CO), tropospheric ozone (O₃) and particulate matter (PM10 and PM2.5). Depending on atmospheric conditions, these compounds may undergo chemical reactions, horizontal and vertical transport, as well as accumulation in poorly ventilated areas, which makes their dispersion processes extremely complex. Among these, nitrogen dioxide (NO₂) is a particularly significant compound, being one of the main components of nitrogen oxides (NOₓ). Although present in the atmosphere in relatively small quantities, this compound has a significant impact on human health (Dobrzyńska, 2016) and the state of the natural environment (Seangkiatiyuth et al., 2011).
2. Research objectives and methodology
A key prerequisite for implementing effective air quality improvement strategies is a precise understanding of the spatial distribution of pollutants and the identification of the factors responsible for their accumulation. Traditional monitoring stations, whilst providing accurate measurements, have a limited range.
For this reason, the project has developed an advanced machine learning model that enables the estimation and monitoring of nitrogen dioxide (NO₂) levels in areas lacking physical monitoring infrastructure. The modelling results for the Functional Urban Areas under study allow spatial planners to move from general concepts to precisely targeted mitigation measures, such as the designation of clean transport zones or the design of buffer green spaces.
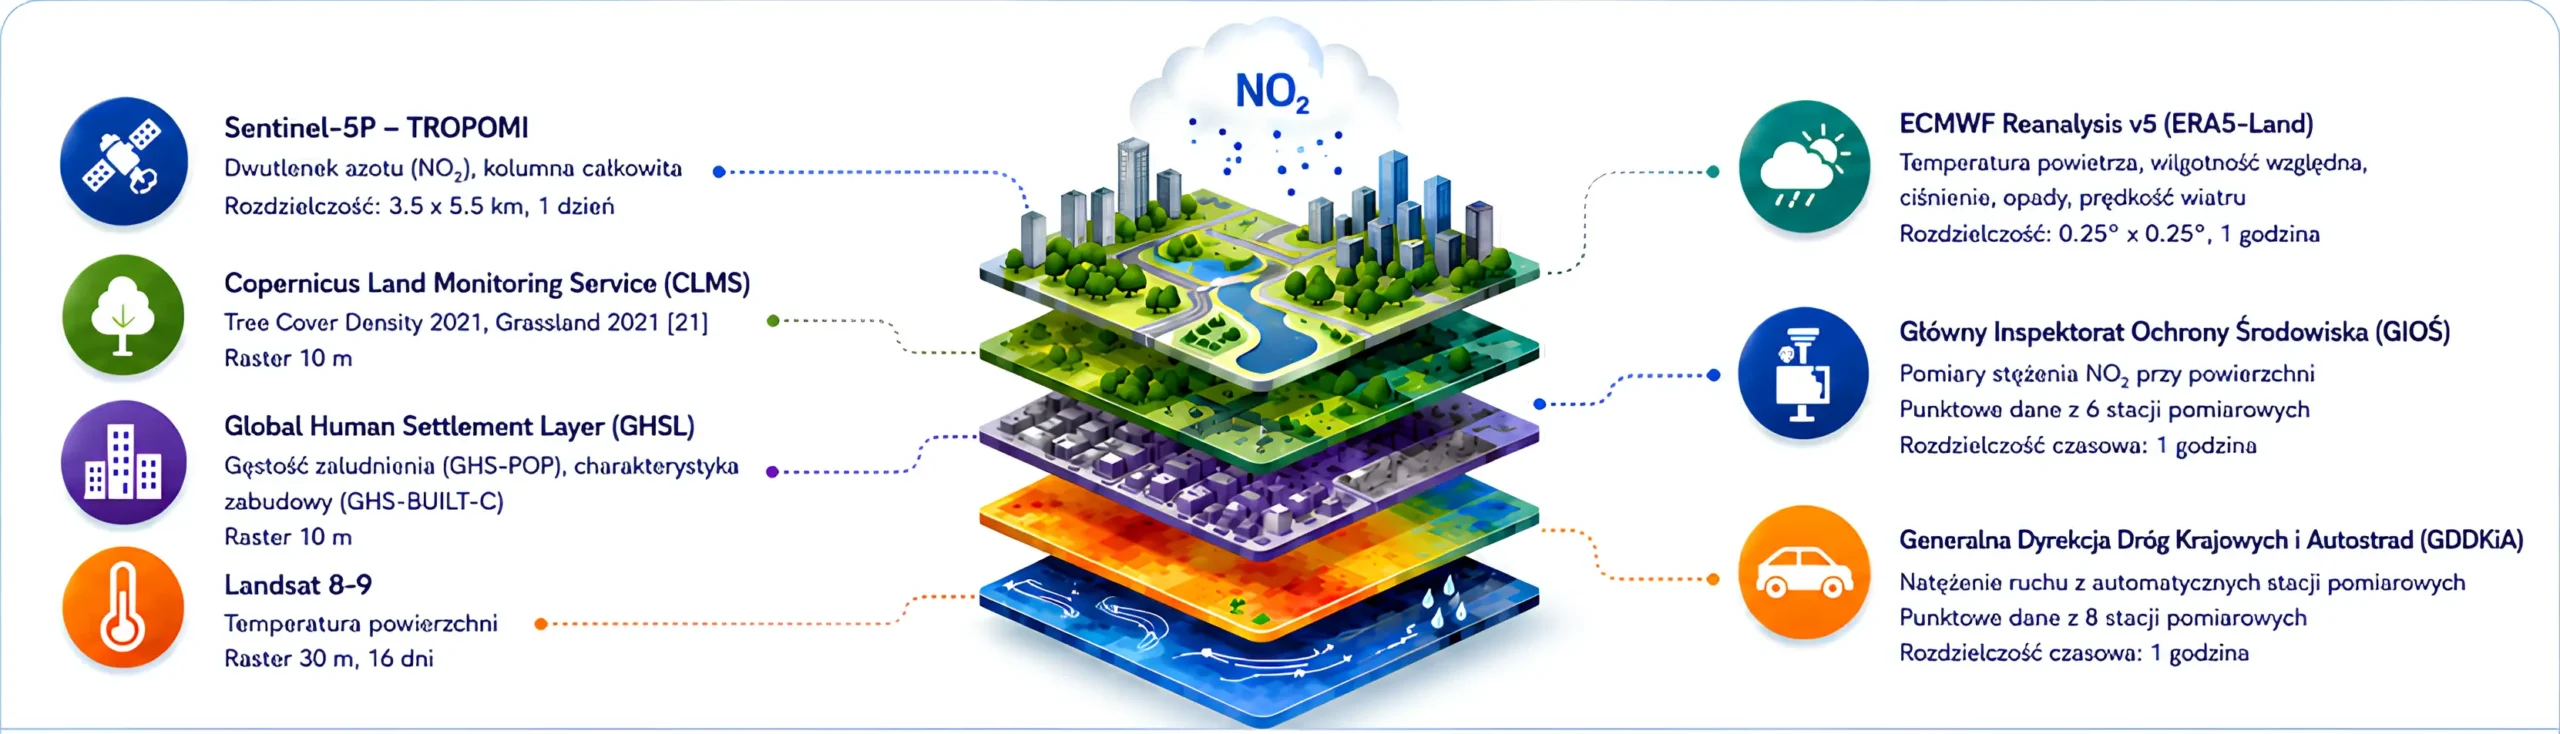
2.1. Multidimensional integration of environmental data
The modelling process required the incorporation of highly heterogeneous datasets reflecting the various factors affecting air quality.
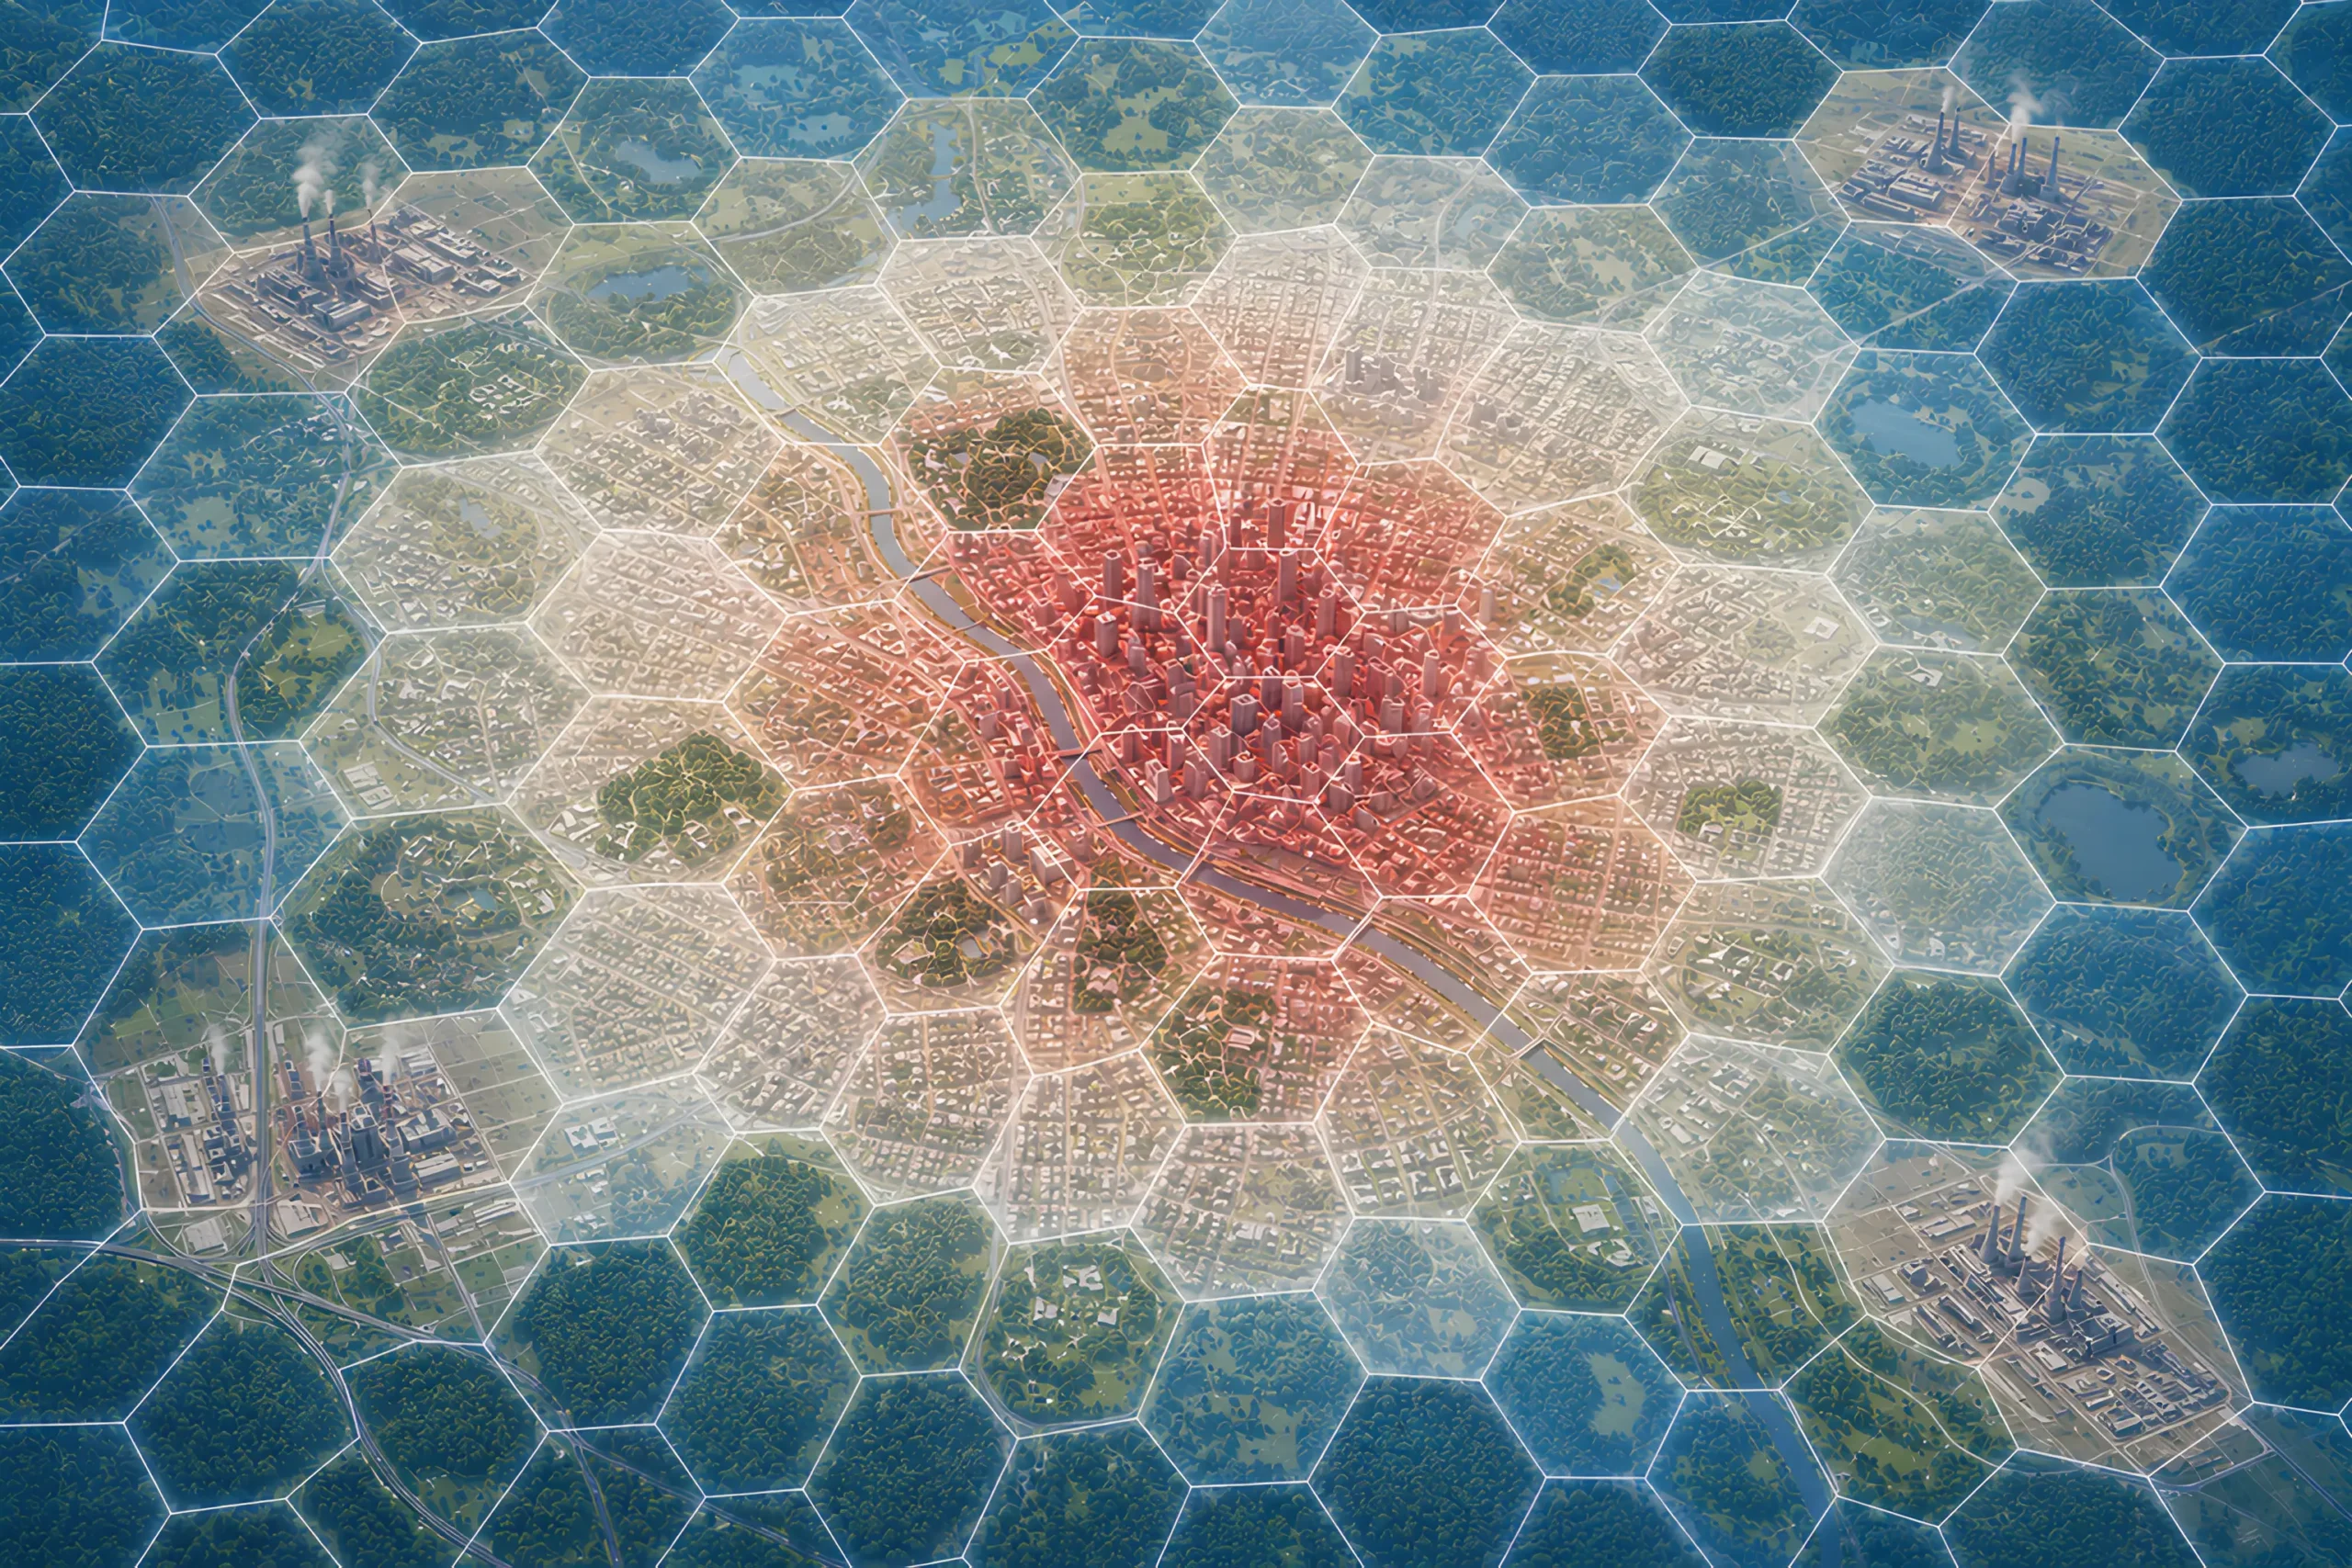
2.2. Application of a hierarchical hexagonal lattice
In order to spatially standardise the collected data, the traditional rectangular grid was replaced with a hierarchical H3 hexagonal grid. This decision was driven by significant analytical benefits. Hexagons are characterised by an equal distance from the centre to all neighbouring cells, which significantly reduces spatial distortions and sampling errors (edge effects). Furthermore, the hierarchical nature of the H3 index enabled smooth and lossless data scaling – from cells with an area of approx. 5.16 km² used in the model training phase, to the target high-resolution grid (approx. 0.11 km²) used to produce subsequent maps.
2.3. Spatial aggregation taking wind dynamics into account
Air pollutants are constantly transported within the atmosphere. To ensure that the model realistically captures these dynamics, explanatory variables (e.g. land cover, road infrastructure) were not assigned to the grid in a static manner. Instead, feature values were calculated as a weighted average from the hexagons located in the so-called upwind area. The extent of the analysed area and the weights assigned to it were dynamically determined by the wind direction and speed at the given measurement hour.
2.4. Model architecture and correction of deviations
The estimation of NO₂ concentrations was based on a Random Forest Regression algorithm, which analysed 33 input parameters. This tool was chosen for its high resistance to overfitting and its effectiveness in modelling non-linear environmental relationships.
However, models based on decision trees have an inherent mathematical limitation that leads to the phenomenon of ‘regression to the mean’. In practice, this means that the algorithm tends to smooth out the results and underestimate extreme values (local pollution peaks). As the identification of critical hotspots was the main objective of the project, the Empirical Distribution Matching (EDM) technique was implemented in the final stage of the work.
3. Results
By applying a trained artificial intelligence model, which was verified with a high degree of accuracy using validation data, it was possible not only to generate precise pollution maps but also to gain a deep understanding of the mechanisms that shape them. The key findings from the analysis carried out for the study areas are presented below.
3.1. Main factors affecting NO₂ concentrations
An analysis of feature importance in the machine learning algorithm and an examination of linear correlations have clearly demonstrated that air quality is determined by the synergy of environmental and anthropogenic factors. The most important factors include:
- weather conditions and seasonal patterns: air temperature and wind speed have by far the greatest impact on the dispersion of pollutants. Falls in temperature during the colder months drastically worsen air quality,
- traffic and urban development pressures: the most significant local, man-made source of NO₂ is road traffic volume. Pollutant accumulation also shows a strong, direct correlation with the density of residential and commercial development,
- Tall vegetation as a buffer: importantly, the presence of tall vegetation (wooded areas, parks) shows a strong negative correlation with NO₂ concentrations. This confirms the role of mature vegetation as a natural filter and an indicator of areas with low emission levels.
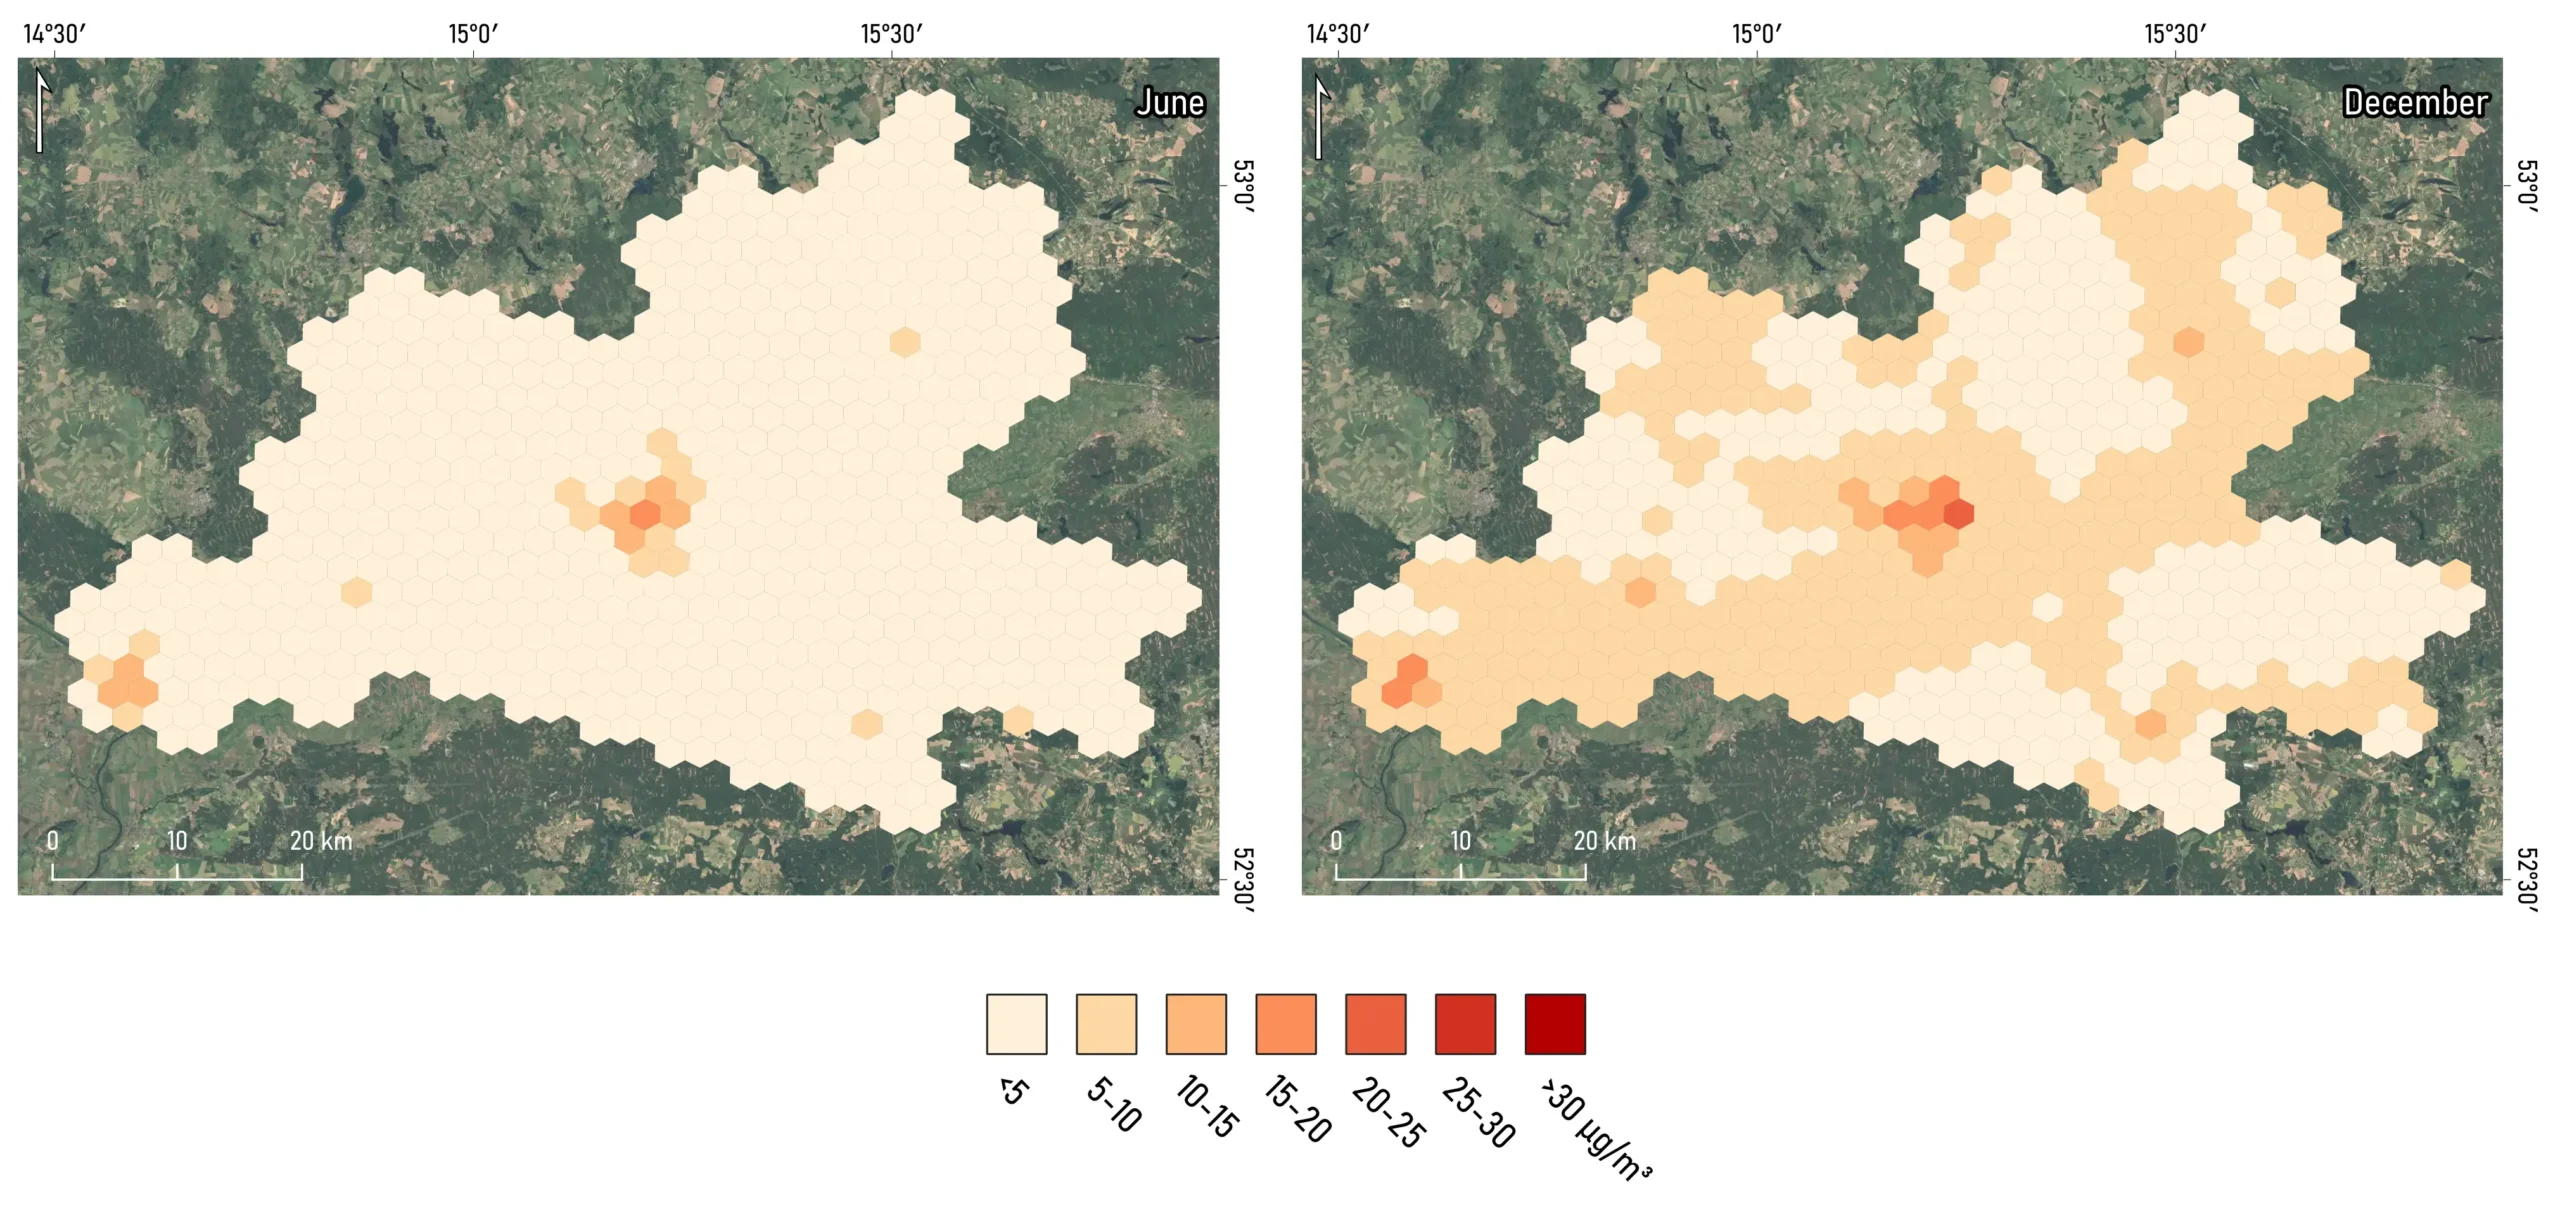
3.2. Seasonality of the phenomenon: summer-winter contrast
Spatial modelling broken down by month highlighted the dramatic impact of seasonality on the urban microclimate. A comparison of maps from the summer and winter periods reveals two distinct pollution profiles:
- summer (June): characterised by very good overall air quality. Elevated NO₂ concentrations are confined almost exclusively to city centres and are linked to background, continuous traffic,
- Winter period (December/January): shows a significant deterioration in air quality across large areas. This is due to the combination of transport emissions and high levels of activity in the district and domestic heating sectors, a situation further exacerbated by temperature inversions and light winds.
3.3. Identification of critical areas (hotspots)
The creation of high-resolution maps has enabled the precise identification of areas posing the highest environmental risk. Spatial analysis reveals the presence of pollution on two scales:
Macro level:
Within the studied FUA areas, pollution is not distributed evenly. Distinct regional ‘islands’ of pollution are clearly visible, corresponding to major urban centres such as Zielona Góra, Nowa Sól and Sulechów. As one moves away from these centres towards agricultural and forested areas, air quality improves dramatically.
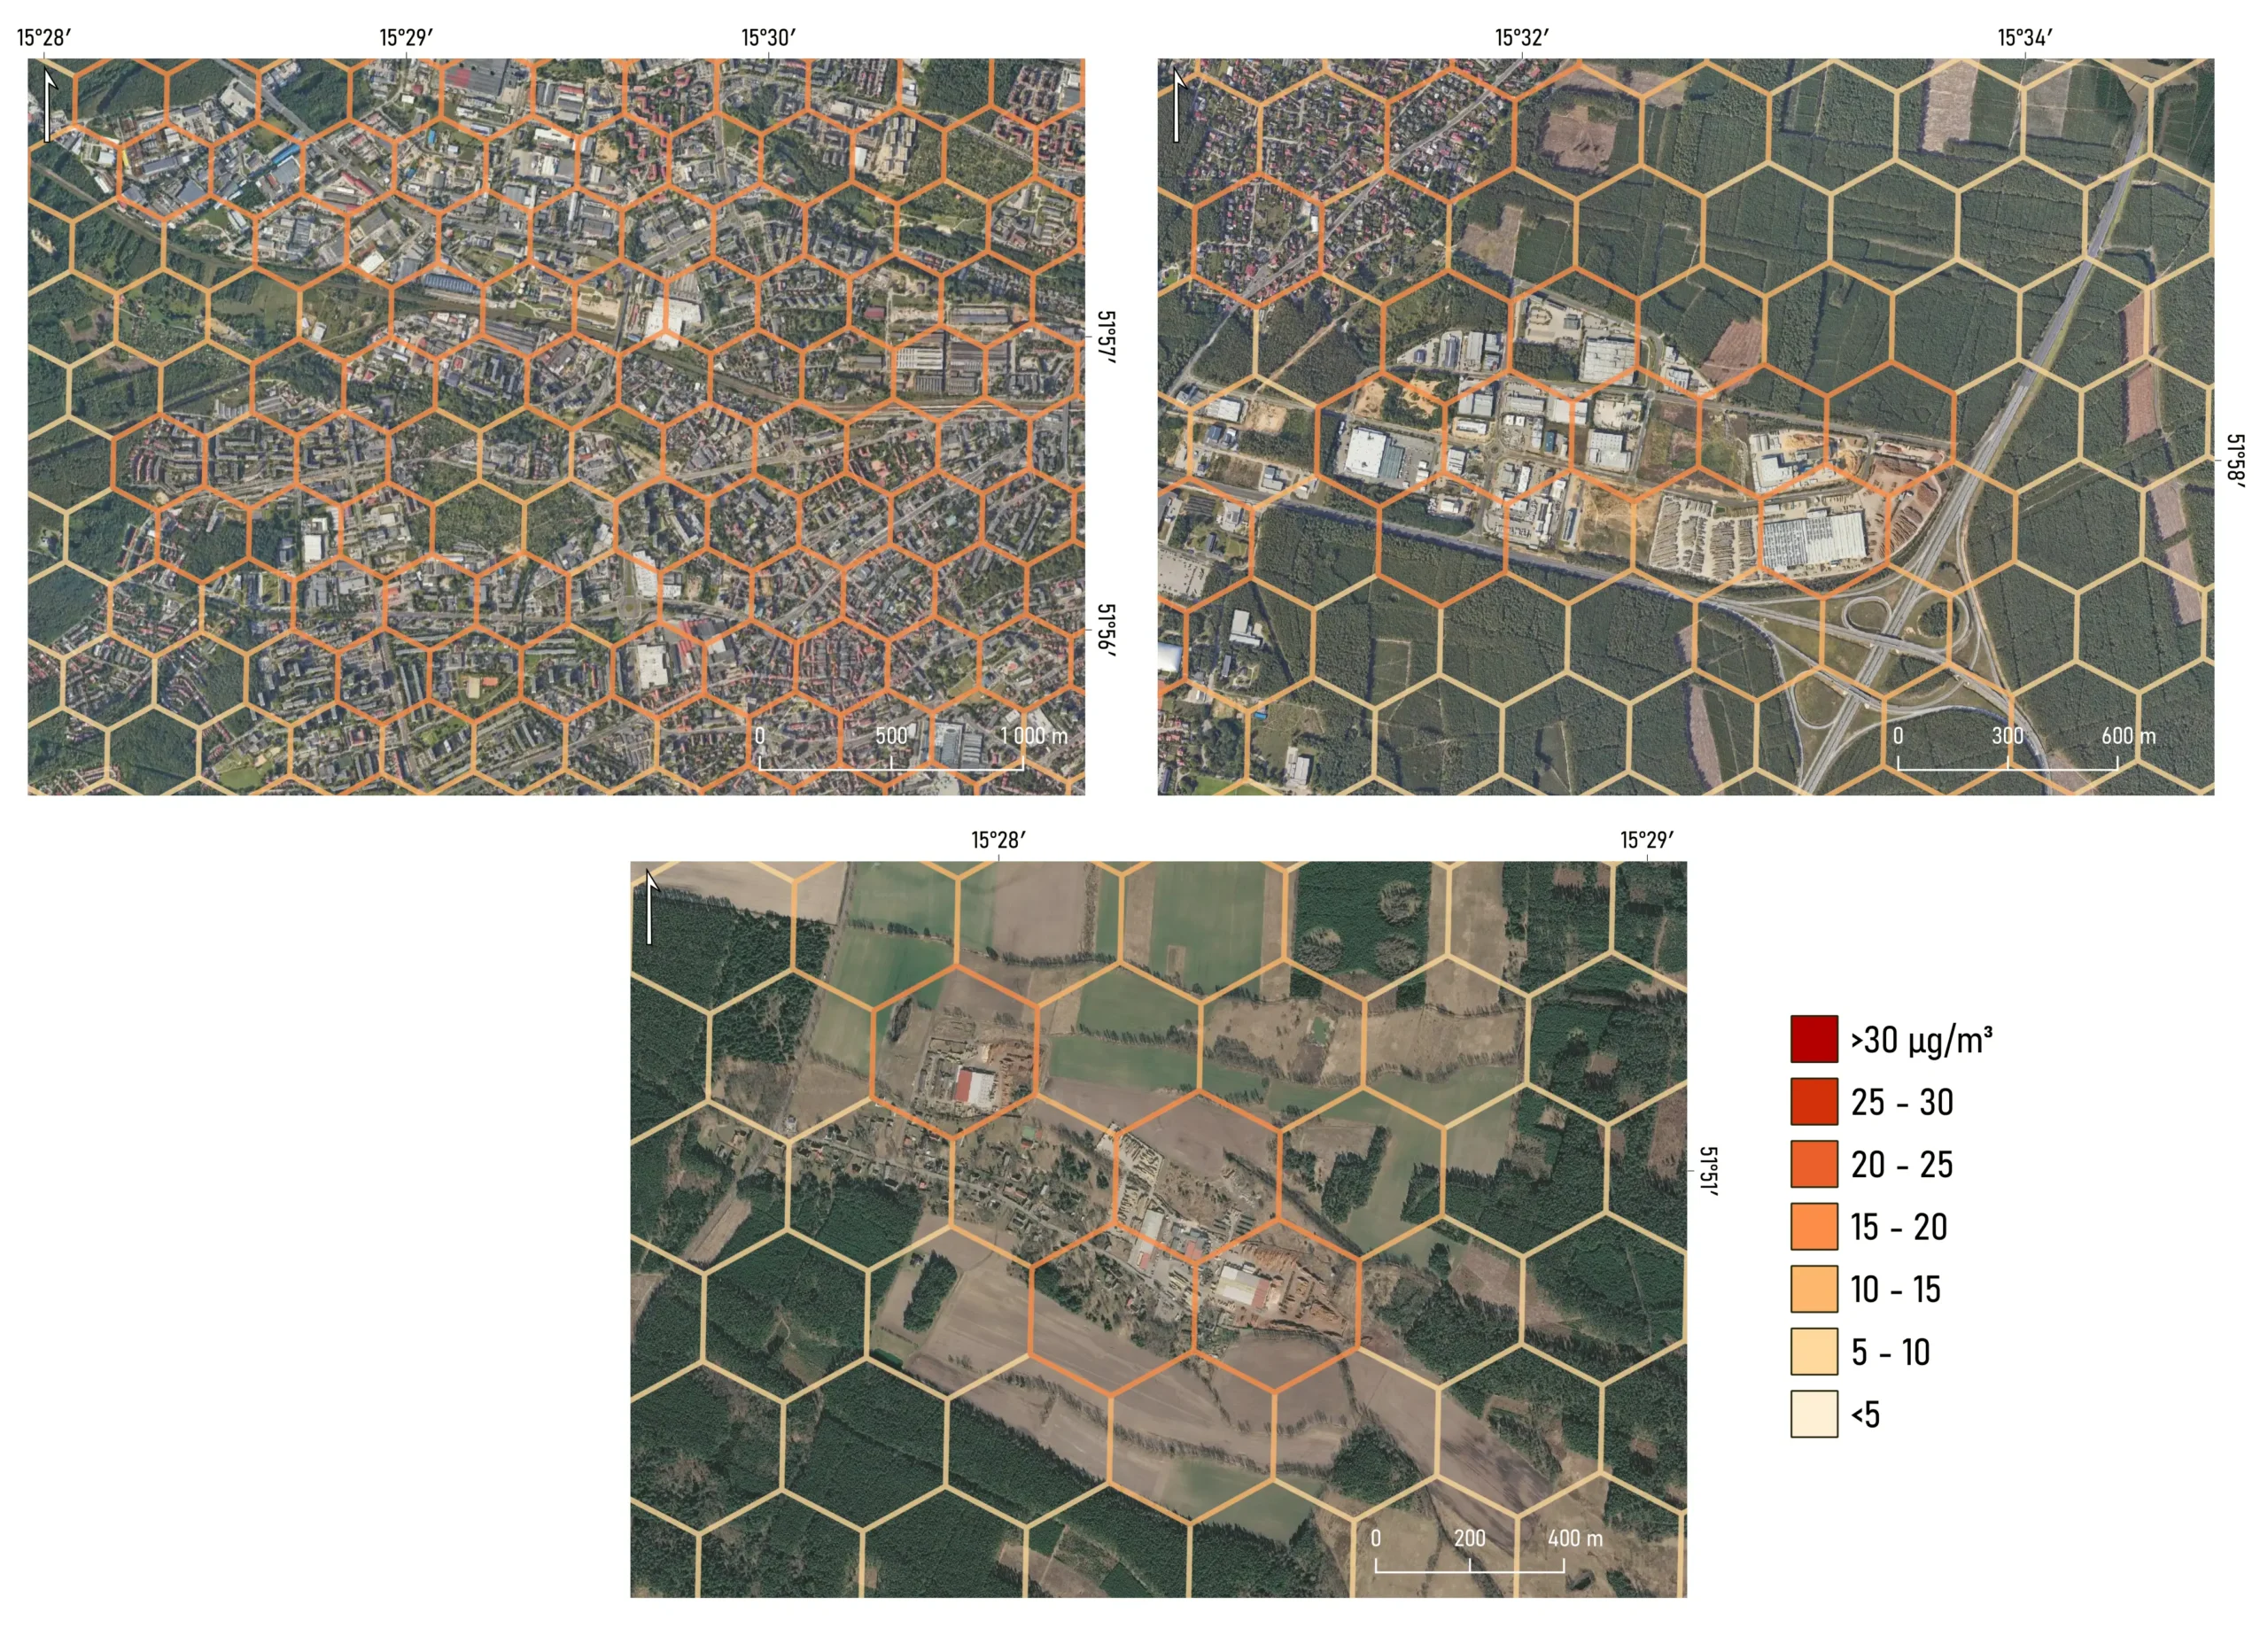
Micro-scale (typology of local hotspots):
Thanks to the granularity of the hexagonal grid, three main types of critical areas requiring tailored interventions have been identified within the cities themselves:
- Dense urban cores: Where traffic in urban canyons overlaps with local heating systems.
- Industrial and logistics zones and motorway junctions: where the main culprit is heavy goods traffic.
- Isolated point sources: Small, outlying suburban settlements where individual heating systems (so-called ‘low-emission’ systems) cause significant localised spikes in pollution levels during the winter season.
4. Comparative analysis: what is driving pollution in Gorzów, and what is driving it in Zielona Góra?
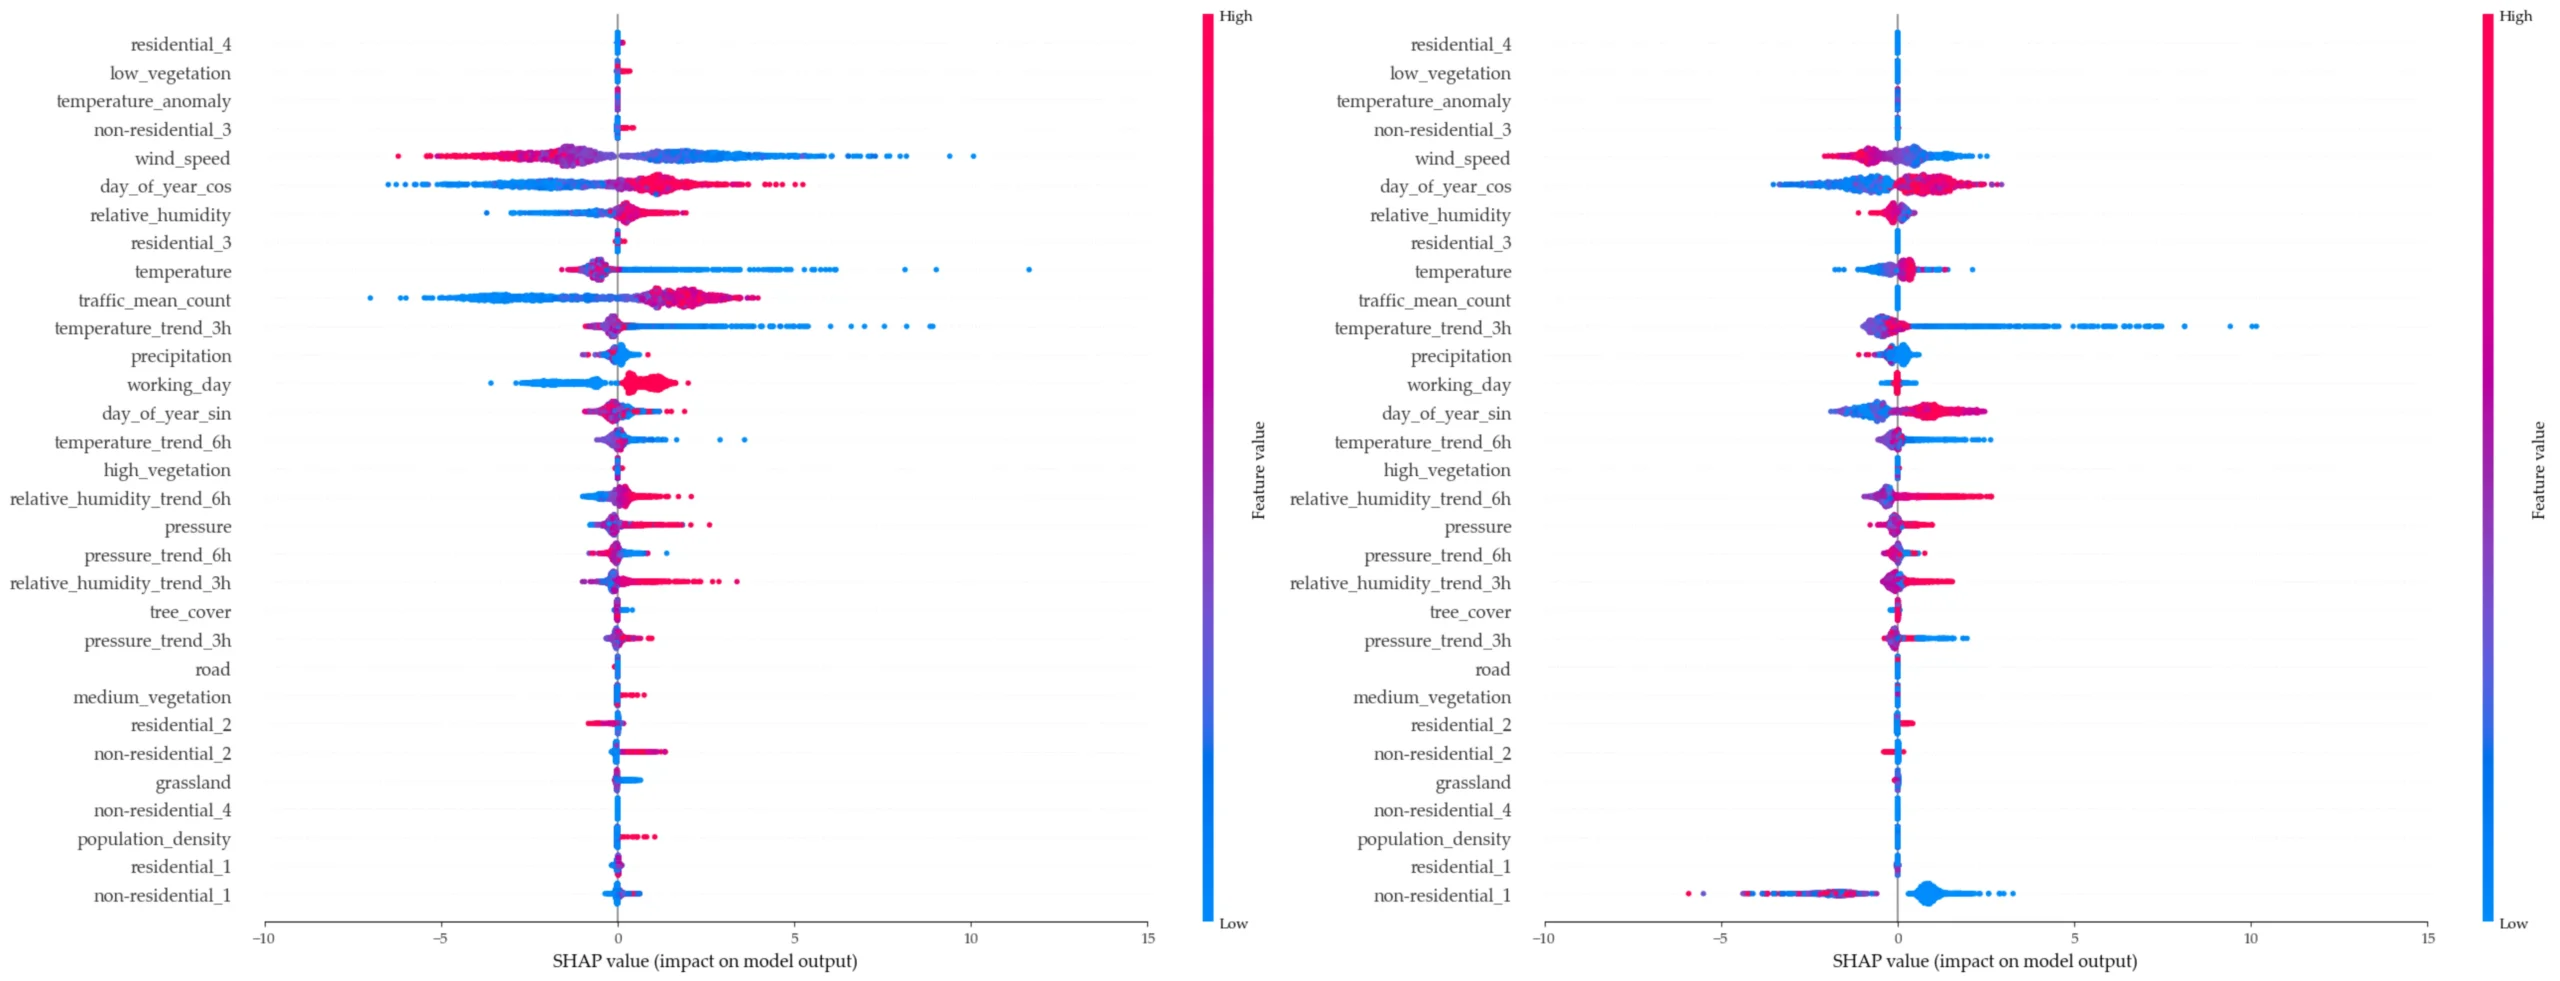
The use of advanced methods for interpreting machine learning models (SHAP analysis) made it possible to look ‘inside’ the algorithm and identify which factors have the greatest influence on NO₂ concentrations in individual cities. The results revealed two distinct emission profiles for the cities studied, which stems not only from their urban differences but also from the specific nature of the available input data.
In Zielona Góra, the pollution profile is typical of cities with heavy traffic, which the model was able to capture accurately thanks to access to data from automatic traffic counters.
- Traffic is the main factor: The variable describing traffic volume (traffic_mean_count) is one of the most significant factors contributing to elevated NO₂ levels.
- The effect of working days: The model identified a very strong influence of the ‘working_day’ variable, confirming that pollution peaks are closely correlated with residents’ daily commutes to work and school.
- Wind as a natural filter: In Zielona Góra, wind speed (wind_speed) proved to be the most significant factor in reducing pollution. A lack of wind immediately leads to localised build-ups of exhaust fumes in built-up areas.
The situation looks quite different in the charts for Gorzów Wielkopolski, where the direct impact of traffic volume proved to be significantly less significant. This phenomenon stems directly from the lack of GDDKiA monitoring stations in this area, which created a gap in the hard data on traffic flows. In this situation, the artificial intelligence algorithm demonstrated its ability to adapt, basing its predictions on other available variables.
- The variable describing non-residential and commercial areas (non-residential_1) has the strongest influence on the model’s predictions in Gorzów. In the absence of direct traffic counters, it is the spatial distribution of commercial and industrial zones and logistics hubs that has become the algorithm’s indicator of areas with the highest emissions.
- Strong dependence on seasonal background: Seasonal indicators and short-term temperature trends (temperature_trend_3h) topped the list of the most important variables in Gorzów. This indicates that, with limited knowledge of vehicle traffic, the model linked NO₂ fluctuations more strongly to seasonal background (the heating season) and meteorological conditions.
5. How can this data be used?
- Clean Transport Zones (CTZs): Maps provide solid, factual evidence in public debates. They show where restricting the use of combustion-engine vehicles will bring the greatest health benefits to residents.
- The expansion of the monitoring network: The case of Gorzów Wielkopolski clearly demonstrates to decision-makers the need to invest in urban vehicle counting systems, which will enable even more detailed analytical models in the future.
- Location of sensitive facilities: The model helps to avoid planning errors, such as the construction of new schools, nurseries, hospitals or care homes in areas where transport and heating emissions accumulate over long periods.
- Protecting air corridors: Data shows which undeveloped corridors protect cities from pollution, providing grounds for their legal protection.
The results of the analysis clearly show that there is no one-size-fits-all solution. Strategies must be precisely tailored to the local situation:
- Traffic and transport management: Where pollution is directly driven by the daily commute, the priority should be to calm traffic in city centres, prioritise public transport, and gradually replace the public transport fleet.
- Urban planning and buffer green spaces: As the case of Gorzów has shown, pollution is heavily influenced by the development of non-residential areas. Cities should focus on creating dense, green buffer zones around service and industrial areas and must ensure that heavy goods vehicle traffic is routed outside the compact urban area.
- Development of blue-green infrastructure: The model has clearly demonstrated that wind speed is the most effective means of purifying the air. The absolute investment priority must be to maintain natural ventilation corridors and to plant tall vegetation, which acts as a physical and biological filter for exhaust fumes.
Bibliography
Ballschmiter, K. (1992). Transport and Fate of Organic Compounds in the Global Environment. Angewandte Chemie International Edition in English, 31(5), 487–515. https://doi.org/10.1002/anie.199204873
Seangkiatiyuth, K., Surapipith, V., Tantrakarnapa, K., and Lothongkum, A. W. (2011). Application of the AERMOD modelling system for environmental impact assessment of NO₂ emissions from a cement complex. Journal of Environmental Sciences, 23(6), 931–940. https://doi.org/10.1016/S1001-0742(10)60499-8
Swain, C. K. (2024). Environmental pollution indices: A review of heavy metal concentrations in air, water and soil near industrial and urban areas. Discover Environment, 2(1), 5. https://doi.org/10.1007/s44274-024-00030-8