Visual attractiveness of the landscape in the context of recreation and tourism as an example of cultural ecosystem services
The project will propose and apply a method for the evaluation and cartographic presentation of one aspect of ‘comprehensive landscape science’, namely the recreational and leisure value of the landscapes of the Lubuskie Voivodeship.
1. Landscape
The definition of landscape proposed by the European Landscape Convention has been adopted as “an area perceived by people, whose character is the result of the action and interaction of natural and/or human factors”. This approach justifies the alignment of the project’s objectives with those of the aforementioned Convention. These include promoting the protection, management and planning of the landscape, as well as organising and coordinating European cooperation in fostering sustainable development and public well-being.
The scope of the Convention applies to the entire territory of the European Union and covers natural, rural, urban and suburban areas.In this context, landscape (‘a holistic natural-cultural continuum’) constitutes a shared cultural heritage of both a tangible and intangible nature. Its characteristics, components and significance have become the subject of interdisciplinary research as well as social responsibility and concern. Also significant are the strong links and importance of ecosystem services to landscape ecology and humanistic geography, as well as the fact that many – particularly socio-cultural – ecosystem services are generated at the landscape level and are classified as so-called landscape services.
A key argument in favour of this approach is the availability of a digital database containing the distribution and characteristics of Poland’s current landscapes. This database was created as part of a so-called landscape audit, carried out in a manner that ensures methodological consistency and the comparability of results across the whole country. It is assumed that the landscape categories of the Lubuskie Voivodeship identified in 2024 during the audit will be used as one of the most important basic reference areas for carrying out spatial analyses of ecosystem services. At the same time, the possibility of taking into account and using other classifications as necessary is not ruled out, e.g. land cover and land use (CORINE), the country’s administrative division (TERYT), the European classification of territorial units (NUTS/LAU), thematic databases on the environment and landform, as well as the use of regular grid squares.
2. The attractiveness of the landscape
Understood in this way, the landscape is a source of various types of services, depending on the nature and spatial distribution of its components, as well as the processes and phenomena occurring within them. These services, viewed as benefits, may take the form of:
- tangible products or services with relatively easily measurable, economically quantifiable values,
- intangible qualities, which are more difficult to assess objectively and depend on context, personal preferences, interests, experiences, emotional sensitivity, and cultural and civilisational factors.
The latter category includes the concept of landscape attractiveness. Bearing in mind that ‘de gustibus non est disputandum’, one can nevertheless assume that the attractiveness of places and spaces, as well as the people who make up a given landscape, will always be influenced by factors such as natural conditions (topography, flora, fauna, meteorology), anthropogenic elements (land use, infrastructure, architecture, demography, history, literature and the unique identity known as genius loci), as well as transport and economic accessibility.
A multi-factor assessment of landscape attractiveness is carried out to achieve various practical objectives. Examples of these include determining a region’s tourism potential, selecting tourist destinations, valuing property, identifying areas of natural value, and supporting the regional spatial planning process.
The selection and application of a specific method for assessing landscape attractiveness for recreational and leisure purposes in the Lubuskie Province will be carried out as part of this project, based on the results of an online public consultation and educational and participatory expert workshops.
2.1. Definition of landscape attractiveness
For the purposes of this study, we define the term ‘landscape’ as a geographical area characterised by the presence of observable, natural and anthropogenic landscape elements. This definition encompasses the physical characteristics of areas, without necessarily excluding human perception, and allows for a broad interdisciplinary comparison of different approaches. We recognise that landscapes can vary in size, even down to a diameter of less than a few kilometres, whilst landscape elements are usually identifiable in aerial photographs and often range in width from 10 m to 1 km (Forman and Godron; 1986).
A ‘landscape element’ is defined as a natural or anthropogenic object, category or feature, including an ecosystem type, that is observable at the landscape scale (Erikstad et al., 2015). The “biophysical concept of landscape” is used in this review to describe methods relating to the physical content of the landscape (natural and anthropogenic landscape elements), whilst the term “holistic” refers to landscape concepts that encompass human perception and cultural relationships with areas.

Fig. 1. Attribute system for the concept of ‘landscape’ (source: Typology of Contemporary Landscapes in Poland, 2015).
2.2. Key elements contributing to the attractiveness of the landscape:
3. A methodology for assessing the landscape attractiveness of the Lubuskie Voivodeship using geoinformation methods, based on ESA Copernicus data and the results of a landscape audit
There are many methods for assessing the qualities of a landscape and its attractiveness; however, in a broad sense, the methodology for studying landscape attractiveness usually boils down to a multi-parameter evaluation (from the Latin *bonus* – good) of selected elements of the natural environment.
Classic studies in Polish geography (Bartkowski, 1974) highlight the influence of factors such as the diversity of the terrain, forest cover, the proportion of water in the land area, and the percentage of the area covered by lakes. More recent studies (Roos-Klein Lankhorst, de Vries, Buijs; 2011) also take into account aspects such as naturalness, historical uniqueness, urbanisation, or negative factors: disruption of the horizon or noise levels. A study for Flanders in Belgium (Vannopen, Digirickx, Gobin; 2021) utilised as many as 12 landscape features and parameters. In Polish literature, one can find both studies based on the assessment of basic features, such as landform, type and diversity of land cover, and the presence of cultural objects (Jakiel; 2015), as well as studies using advanced indicators based on remote sensing data (Sowińska-Świerkosz, Michalik-Śnieżek; 2020).
In the case of this project, the choice of methodology is based on the geographical characteristics of the Lubuskie Voivodeship and the availability of relevant spatial data. The following criteria were adopted for the land classification:
- Variation in land cover
- Varied terrain
- Variation in forest cover
- The presence of positive landscape ‘modifiers’
- The presence of cultural assets and heritage sites
For the three main landscape features, diversity was used as a measure of attractiveness.
The assumption was made that ‘the more diverse its elements, the more attractive the landscape’. Hilly terrain is more attractive than flat terrain, and a mix of these forms is even more attractive. A mosaic of fields, meadows, surface waters and human settlements seems more interesting than a single type of land cover. Field hedgerows undoubtedly add charm to the agricultural landscape. The character of a mixed forest is completely different from that of a pine monoculture. The presence of cultural heritage sites undoubtedly enhances the landscape’s appeal, and their impact often extends spatially and mentally beyond their exact location.
Thanks to modern geoinformation technologies, these and other similar criteria can be expressed in the form of thematic maps, which provide a continuous numerical representation of them.
3.1. Geomorphology of the Lubuskie Voivodeship
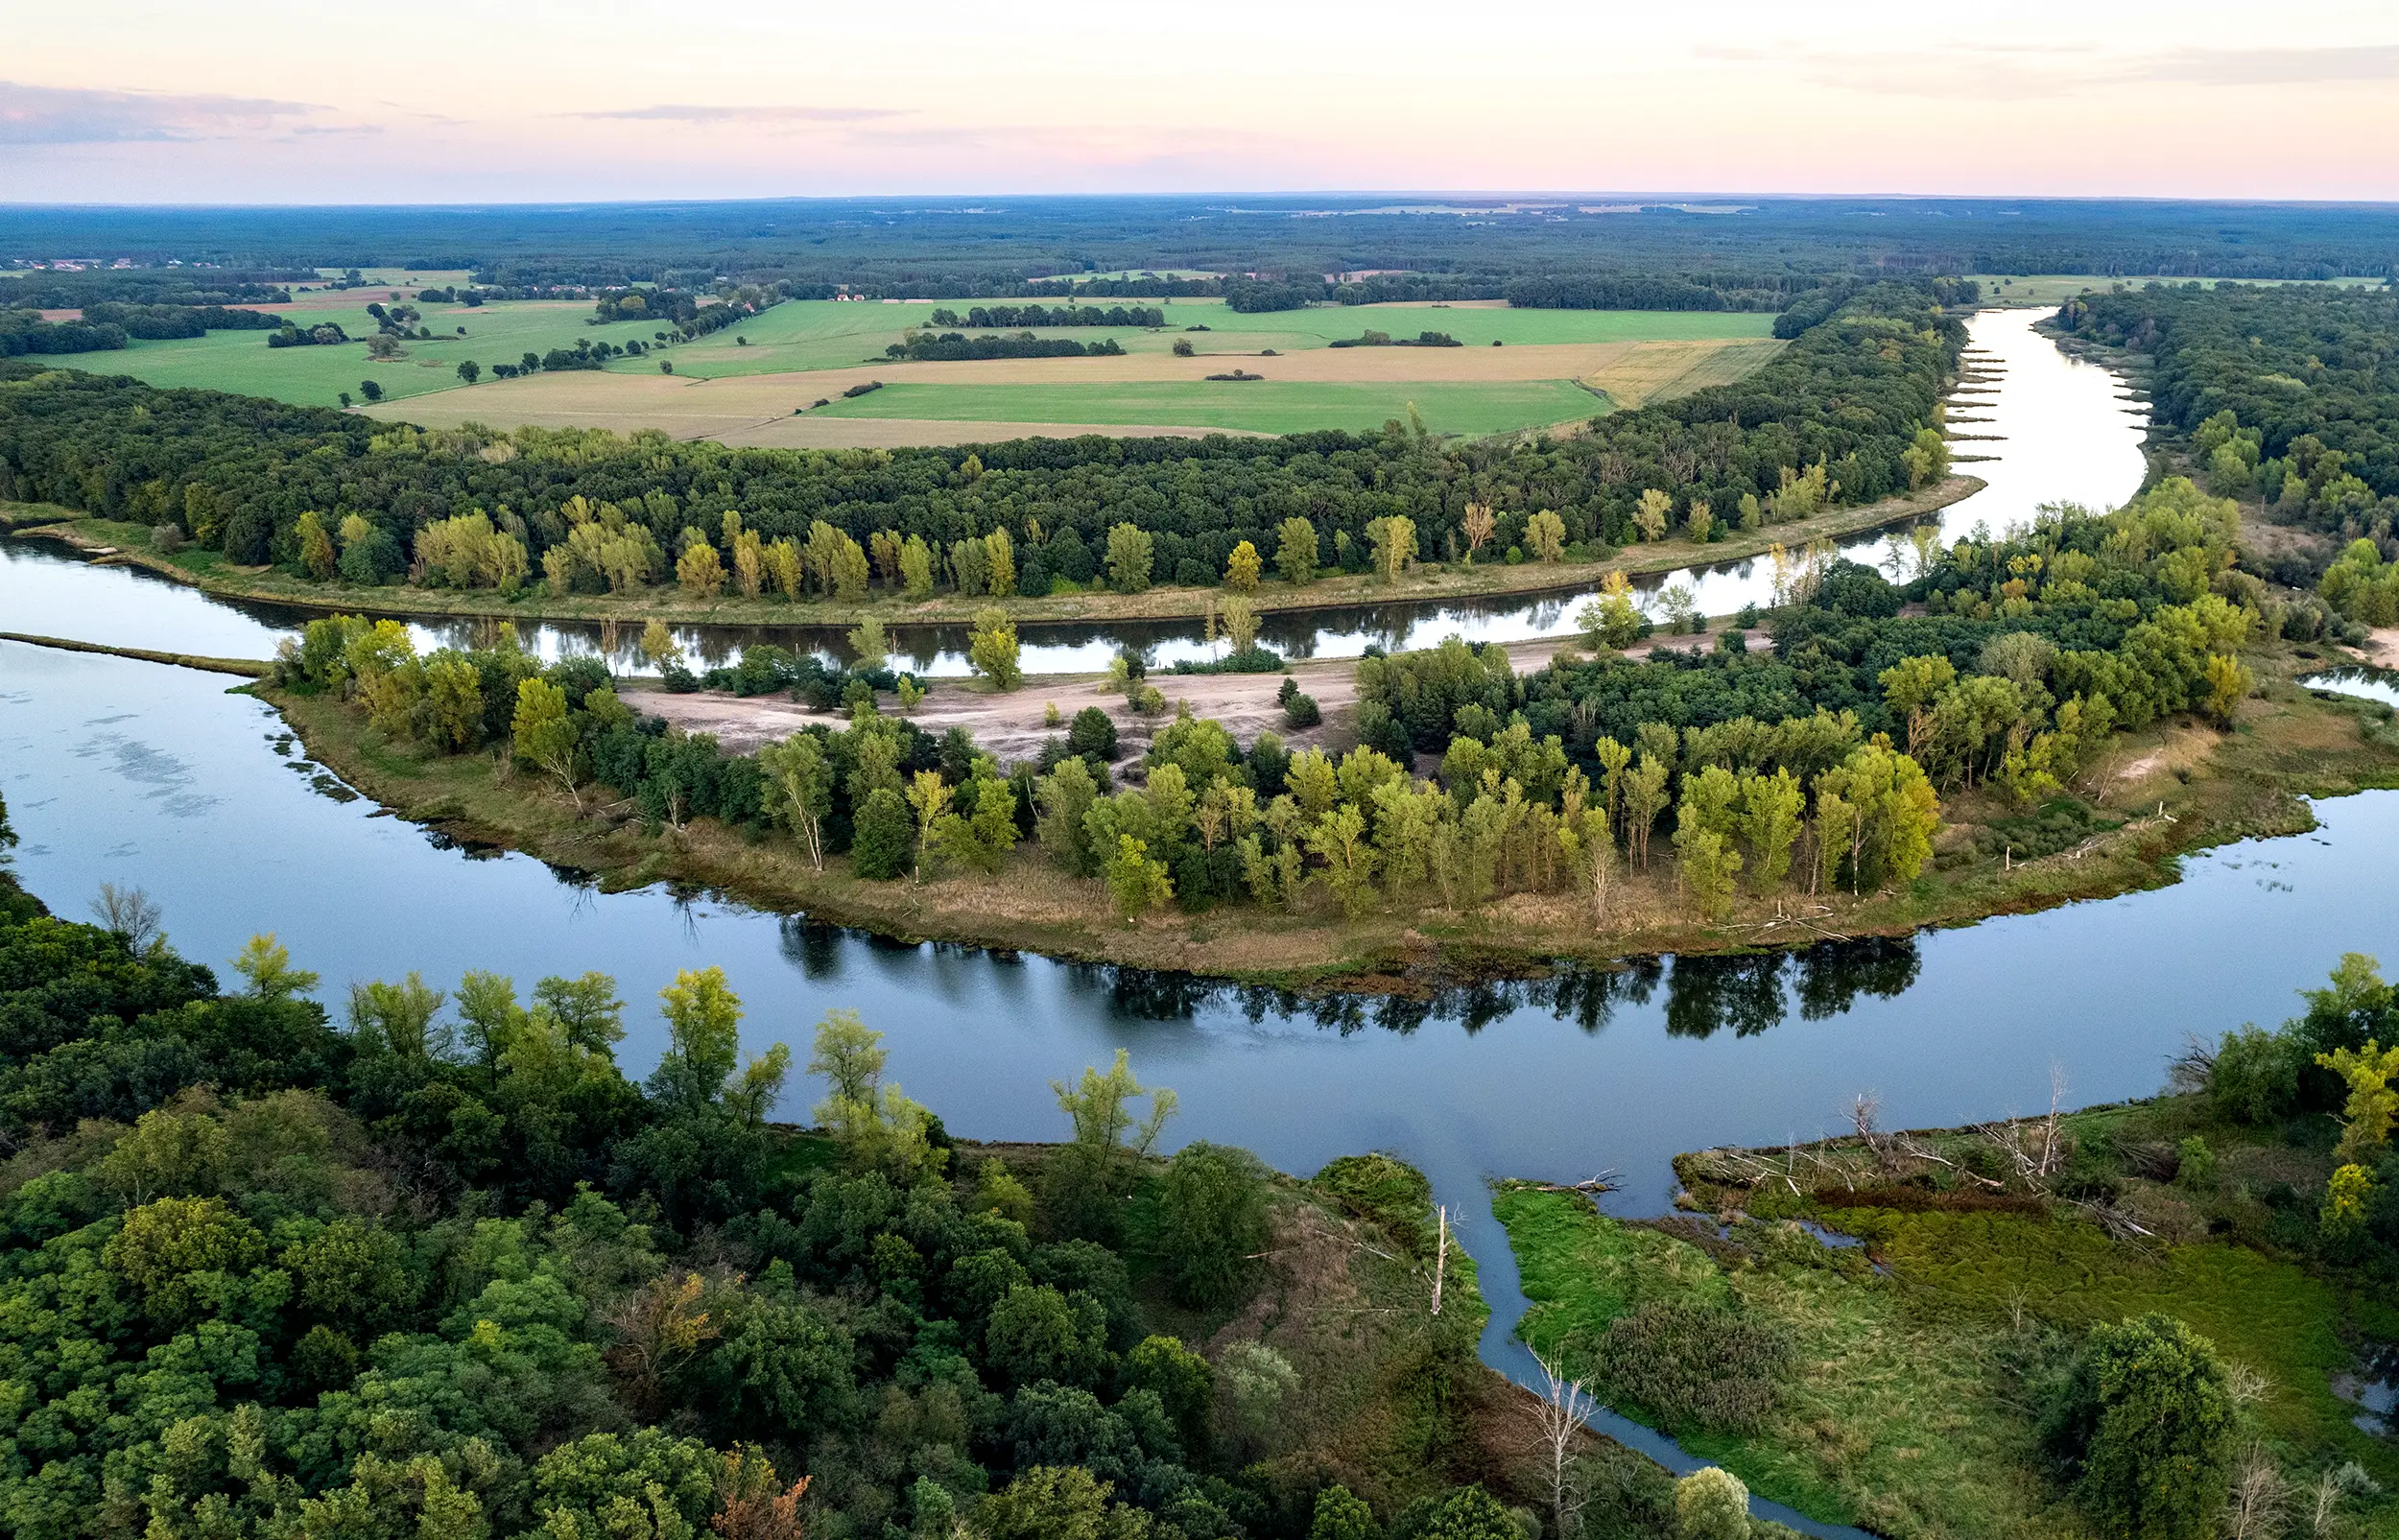
The Lubuskie Voivodeship is characterised by considerable topographical diversity, which has a key influence on the distinctive features of its landscapes. A characteristic feature of the region is the quasi-parallel arrangement of alternating glacial valleys and upland belts, formed as a result of fluvioglacial processes during the retreat of the last glaciation. The highest point in the province is 226.9 metres above sea level (Góra Żarska).
The northern part of the region is more varied and includes areas of the Lubusz Lake District, where numerous glacial landforms are found, such as glacial lakes, moraine hills, eskers and kames. The areas in the southern part of the province were shaped to a greater extent by the Central European glaciation, which resulted in a fairly diverse landscape and left behind groups of eolian landforms. The terrain is flatter, with extensive sandur areas and river valleys (Staniewska-Zątek, Szczepańska; 2013).
A key feature of the landscape is the valleys of the major rivers – primarily the Oder, Warta and Noteć – which form broad depressions and river terraces. The areas along the river valleys also feature wetlands and extensive forest complexes, including parts of the Lower Silesian Forest and the Noteć Forest. The landscape of the Lubuskie Voivodeship as a whole is characterised by a high proportion of forests and lakes, and a relatively low degree of human-induced alteration to the terrain.
3.2. Methodological principles of GIS
The choice of geoinformation processing methodology was dictated by the following requirements:
- the environmental characteristics under analysis are, for the most part, continuous,
- each feature should be represented as a single thematic layer,
- a variable reference unit for selected analyses,
- the ability to blur the boundaries of features (Gaussian filtering),
- the ability to define spatial buffers relative to objects,
- presentation of results in both continuous and discrete form.
On the basis of the above, a raster (grid) model for geospatial data processing was adopted.
A raster model allows for relatively straightforward data manipulation using layer algebra, which is very useful in the construction of multi-parameter indices. Another advantage is the ease with which ‘FuzzyGIS’ techniques can be implemented to represent phenomena with undefined boundaries (Duff D., Guesgen H. W., 2002). In this case, it enables the introduction of blurred boundaries for selected landscape features (in the form of raster filtering), thereby providing a more accurate approximation of them. For the issue under study, this is particularly significant in terms of landscape perception (primarily visual, but of course not exclusively).
There is always some distance between the observer and the landscape. What is more, the impact of landscape features on the observer is not limited to the place where they are found. One might ask questions such as:
- From what distance can you see the lake?
- From which angle does it look best?
- Is the view from the hill nice? How far can you see from there?
- Or perhaps the view of the hill is nicer, but only up close?
which demonstrate that this interaction is reciprocal, and that distance in the observer-landscape relationship is an inherent parameter. It therefore had to be defined as a reference field for a series of calculations within the scope of this study. It was determined empirically and individually in relation to selected landscape features. Land cover diversity was measured for a field with a radius of 1000 m, whilst terrain diversity was determined for a base field with a side length of 500 m. A spatial buffer was defined for selected discrete objects (water bodies: 500 m, cultural features: 200 m), thereby increasing the area of their ‘influence’ and applying a Gaussian blur of the same magnitude to them.
The basic spatial reference unit in the adopted raster model is a pixel covering an area of 100 m on the ground.
Despite the varying resolution of the input data (10, 50, 500 m), all results will be resampled to a resolution of 100 m. This value therefore affects the level of detail and accuracy of the results obtained. In the literature, similar studies at regional scales typically use grid cells of 200–500 m; therefore, given the size of the entire Lubuskie Voivodeship, this analysis is quite detailed.
The assessment of the landscape qualities of the Lubuskie Voivodeship was based on five core criteria. Each criterion forms a composite index expressed as a spatial distribution across the entire province. These indices (as raster GIS thematic layers), appropriately scaled and added together at each stage, ultimately form a single summary attractiveness index.
The diagram below sets out the detailed methodology for processing geographical data for the purposes of this project:
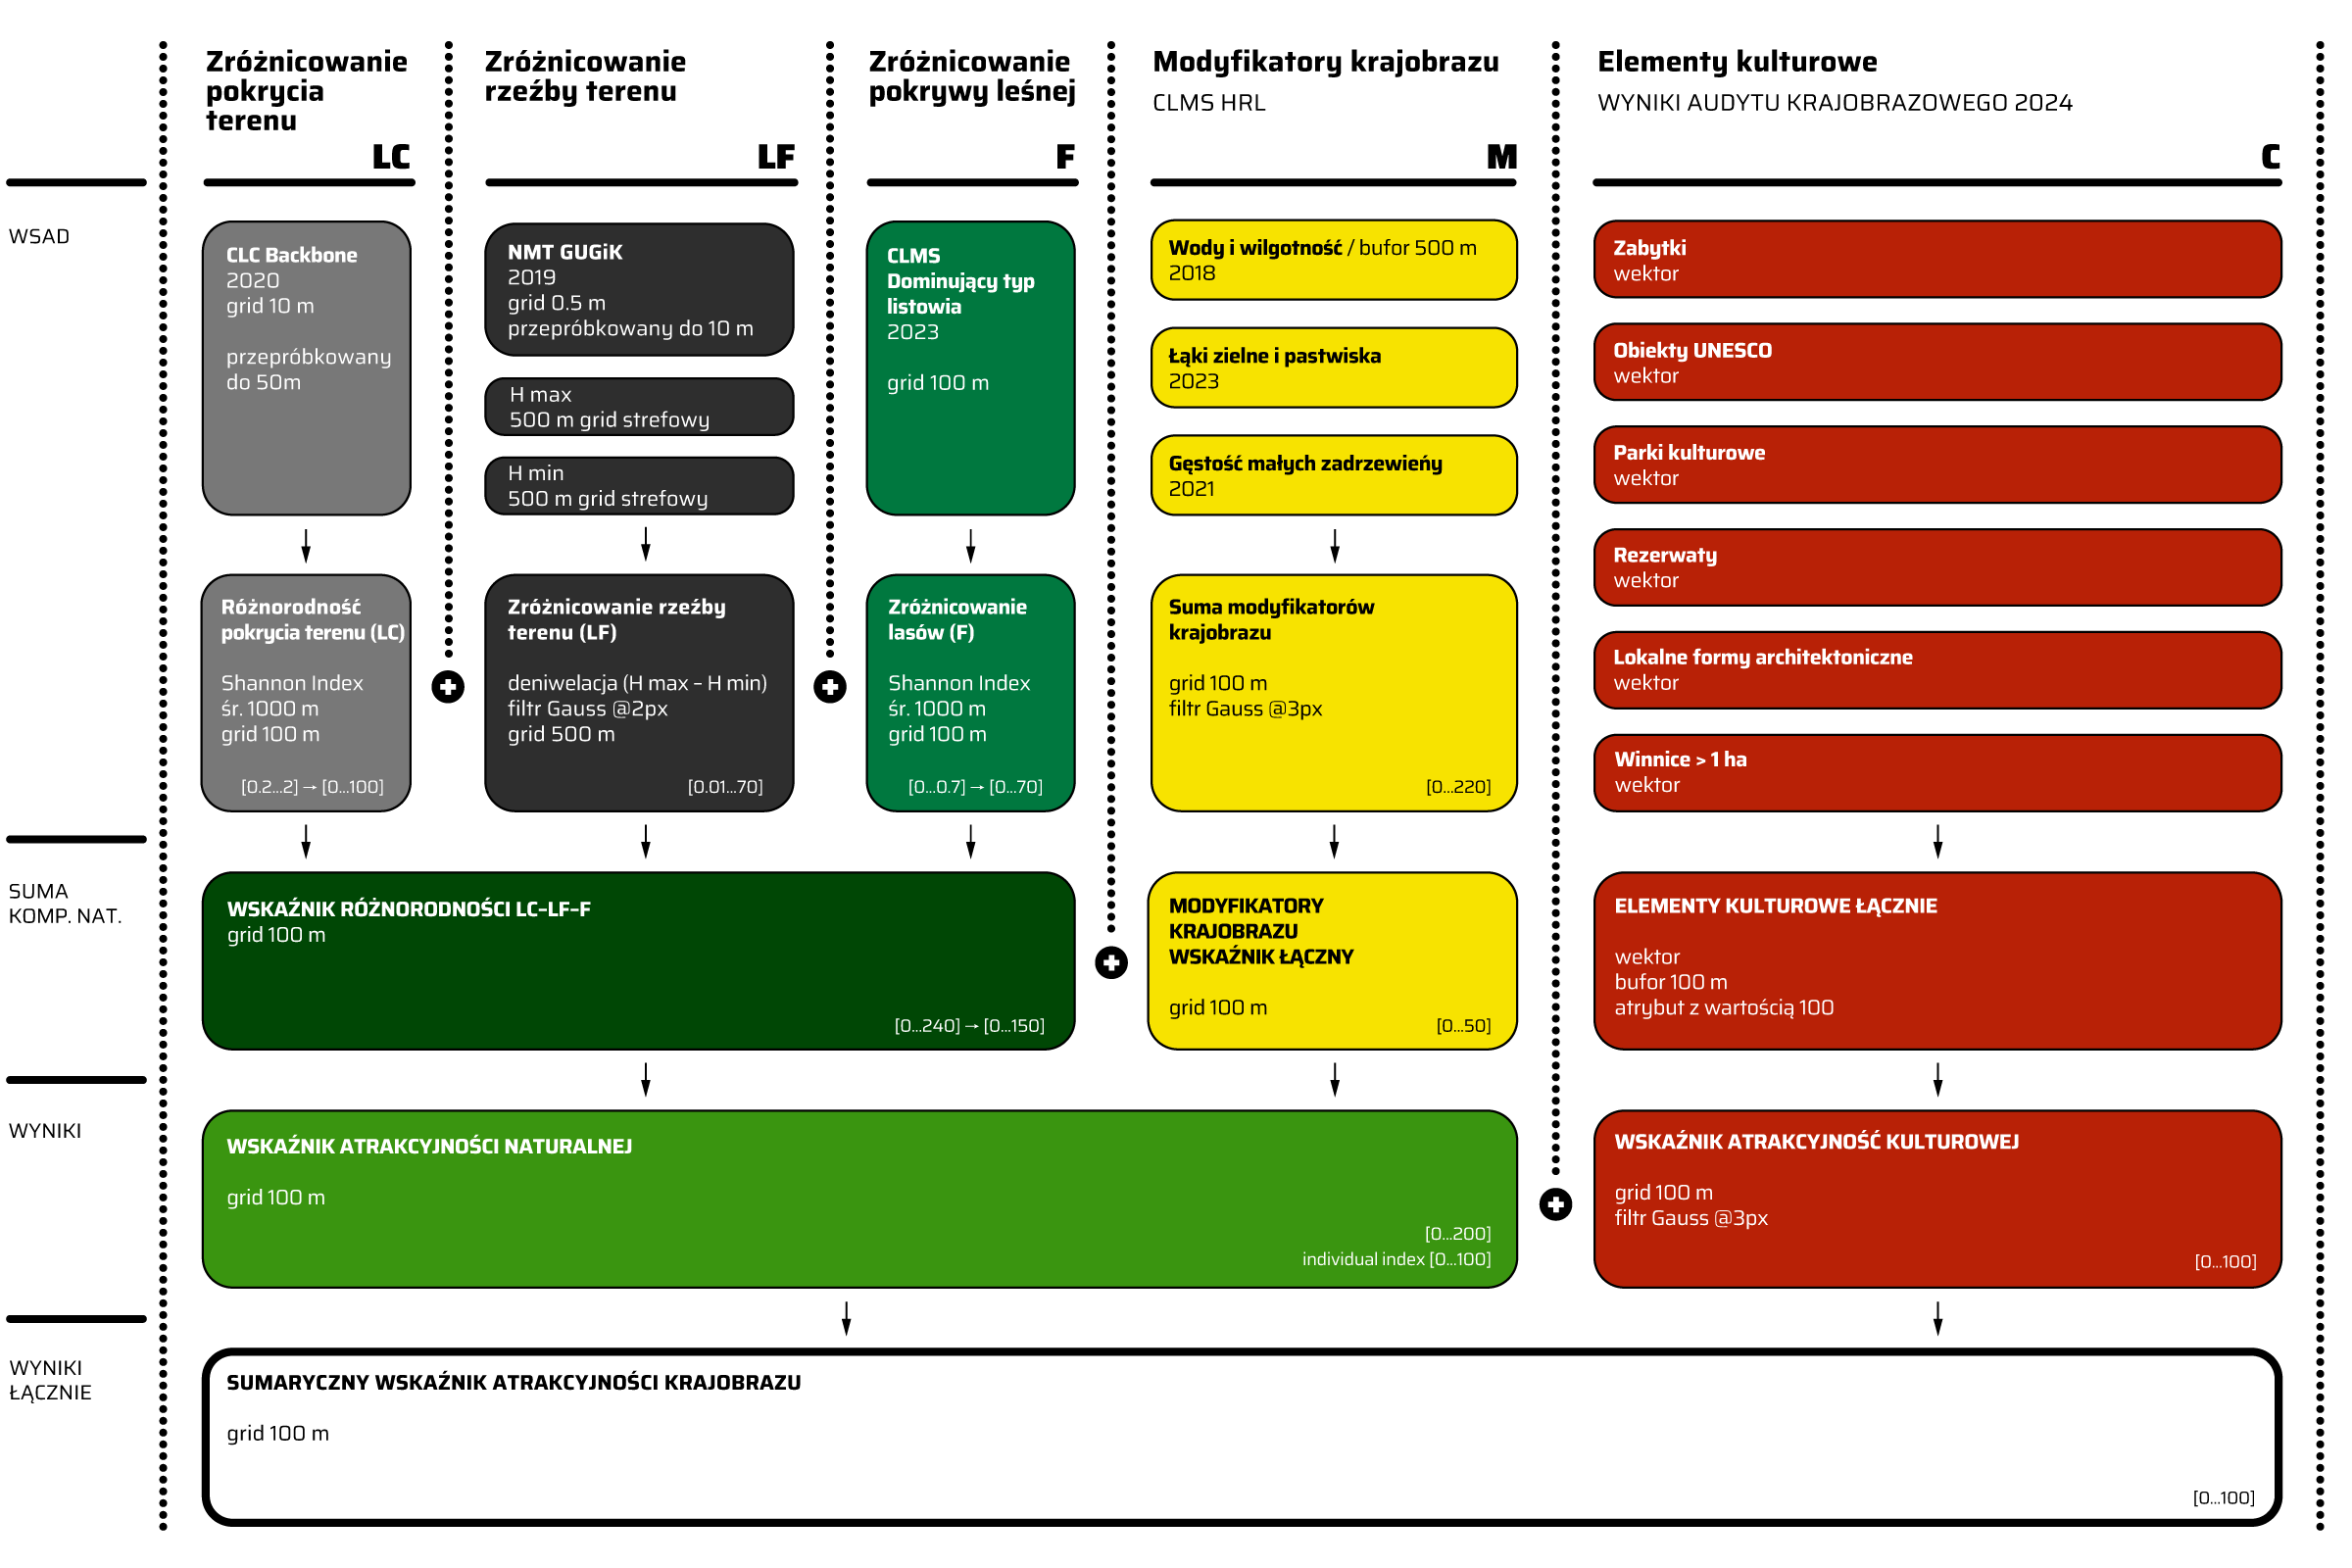
Fig. 2. Methodology for assessing the attractiveness of natural and cultural landscapes.
The GIS methodology used here can be described as focused on ESA Copernicus Earth Observation data, as it relies heavily on the geodata resources of the Copernicus Land Monitoring Service.
3.2. Measures of the attractiveness of selected landscape features
3.2.1. Land cover (LC)
The Shannon-Wiener index is a widely accepted measure of biological diversity within populations and is also widely used in the Earth sciences.
It has been used here to determine the spatial diversity of land cover based on CLC Plus Backbone data, available as a raster thematic layer with a ground resolution of 10 m. The selection of land cover classes comprises mainly natural elements, so it is highly relevant to the issue under analysis.
CLC Plus Backbone land cover classes:
- Impermeable (artificial surfaces, buildings, roads)
- Trees – conifers
- Trees – deciduous trees
- Trees – evergreen deciduous trees
- Low-growing woody plants (shrubs, scattered trees)
- Perennial herbaceous plants (meadows)
- Annual herbaceous plants (arable land)
- Lichens and mosses
- Bare and sparsely vegetated (soil, rocks)
- Water
- Snow and ice
The processing involved calculating the Shannon index using a specialised filtering module within the SAGA GIS software, applied to CLC Plus raster data. A cross-shaped kernel with a radius of 50 pixels was used, corresponding to a cross-shaped base area with sides of 1,000 m on the ground.
This resulted in a digital representation of the variation in land cover types in the form of a raster layer with continuous values in the range [0.2…2], which is typical for this indicator. These values will be rescaled to a different range in subsequent stages of component summation.
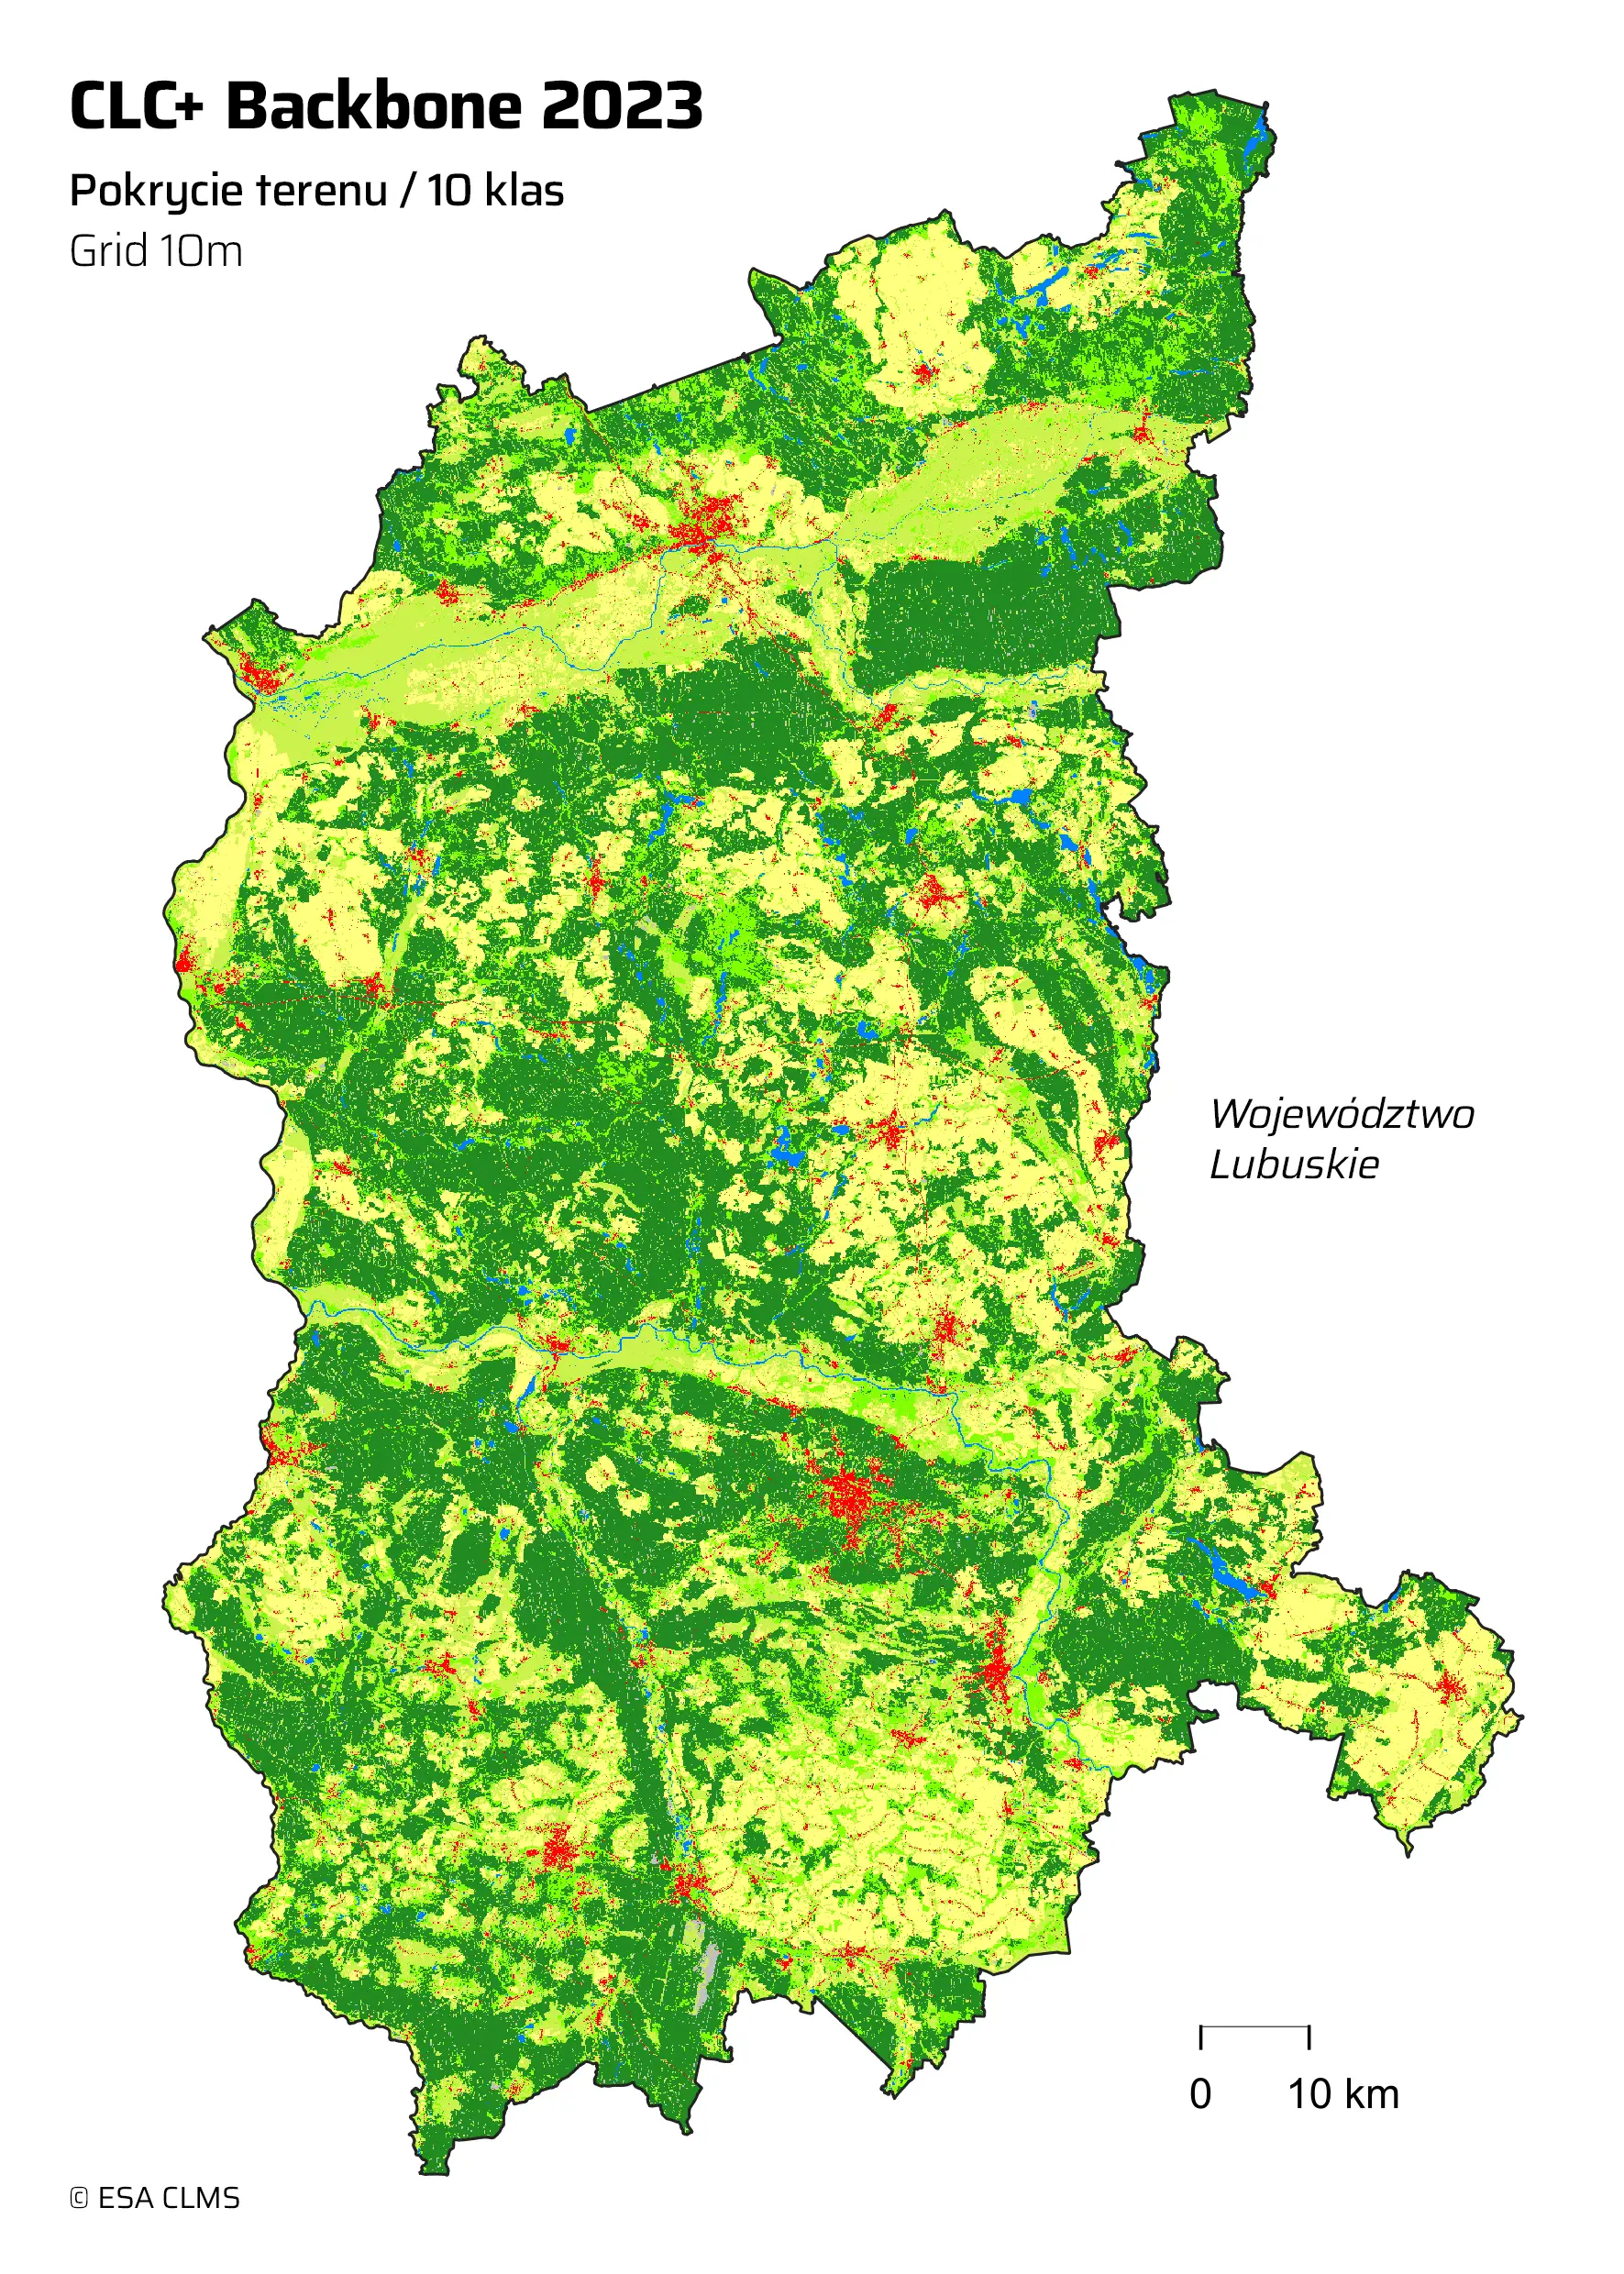
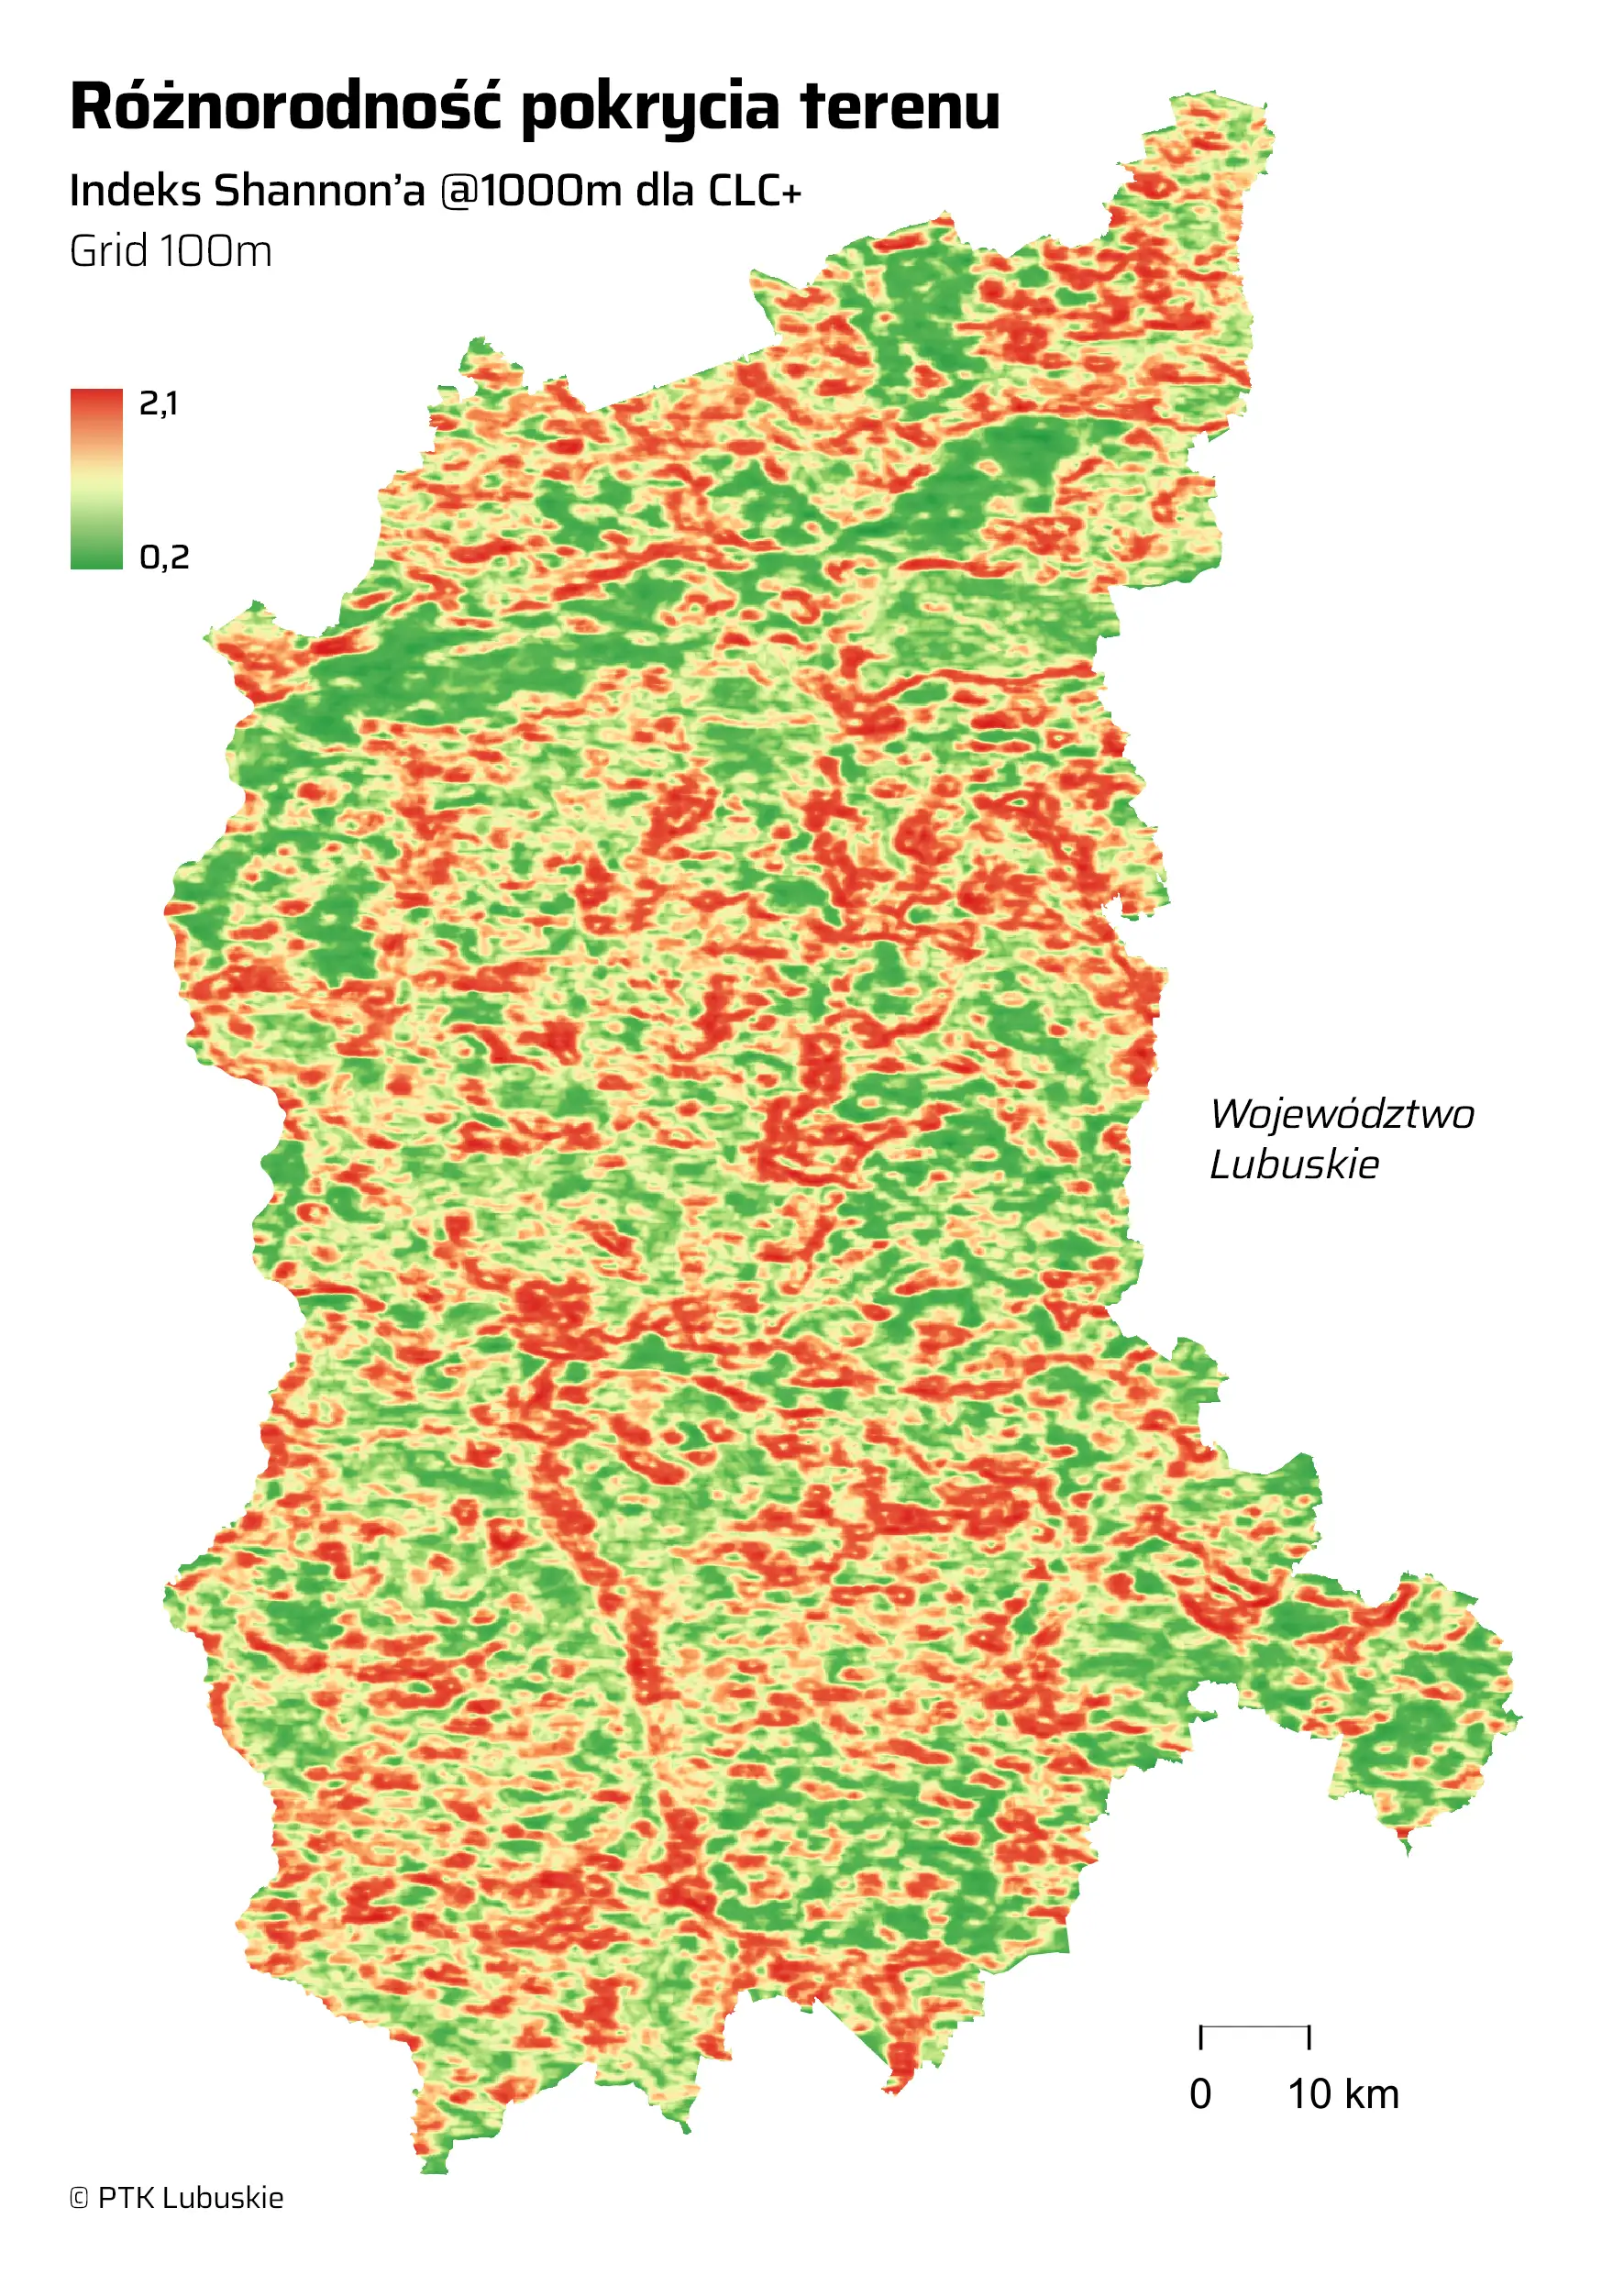
Fig. 3. Land cover in the Lubuskie Voivodeship and its variation. Source: PTK Lubuskie
3.2.2. Topographical variation (LF)
One of the most effective ways of measuring the diversity of the terrain is to analyse the elevation changes within the study area based on a defined reference grid. It can be assumed that the greater these changes, the greater the diversity of the terrain within the area, and thus the greater its potential appeal.
Elevation data for the Lubuskie Province were obtained from the national geoportal. A high-resolution (0.5 m) digital elevation model (2019) in raster format, made available in the sheet format of national topographic maps, was mosaicked to cover the entire province and cropped to its boundaries. For the purposes of this study, its spatial resolution (level of detail) was reduced to 10 m/pixel.
The model in this form was subjected to grid zonal statistics, which are used to calculate a given statistical measure of one raster dataset relative to another. For the reference raster with a pixel size of 500 m, two separate statistics were calculated: the maximum and minimum Z values per NMT, and these were stored in separate raster datasets. Elevation differences in the 500 m grid were calculated using Zmax–Zmin channel algebra. The resulting elevation difference values fall within the range [0…90.7].
A raster elevation map also represents the terrain’s topography; therefore, bearing in mind the factor of distance mentioned in the introduction, the image was subjected to a 3×3 Gaussian filter, which smoothed out all sharp edges and ultimately adjusted the file’s value range to [0.2…71]. Relative values are important for the analysis, so the change in range does not pose an obstacle here.
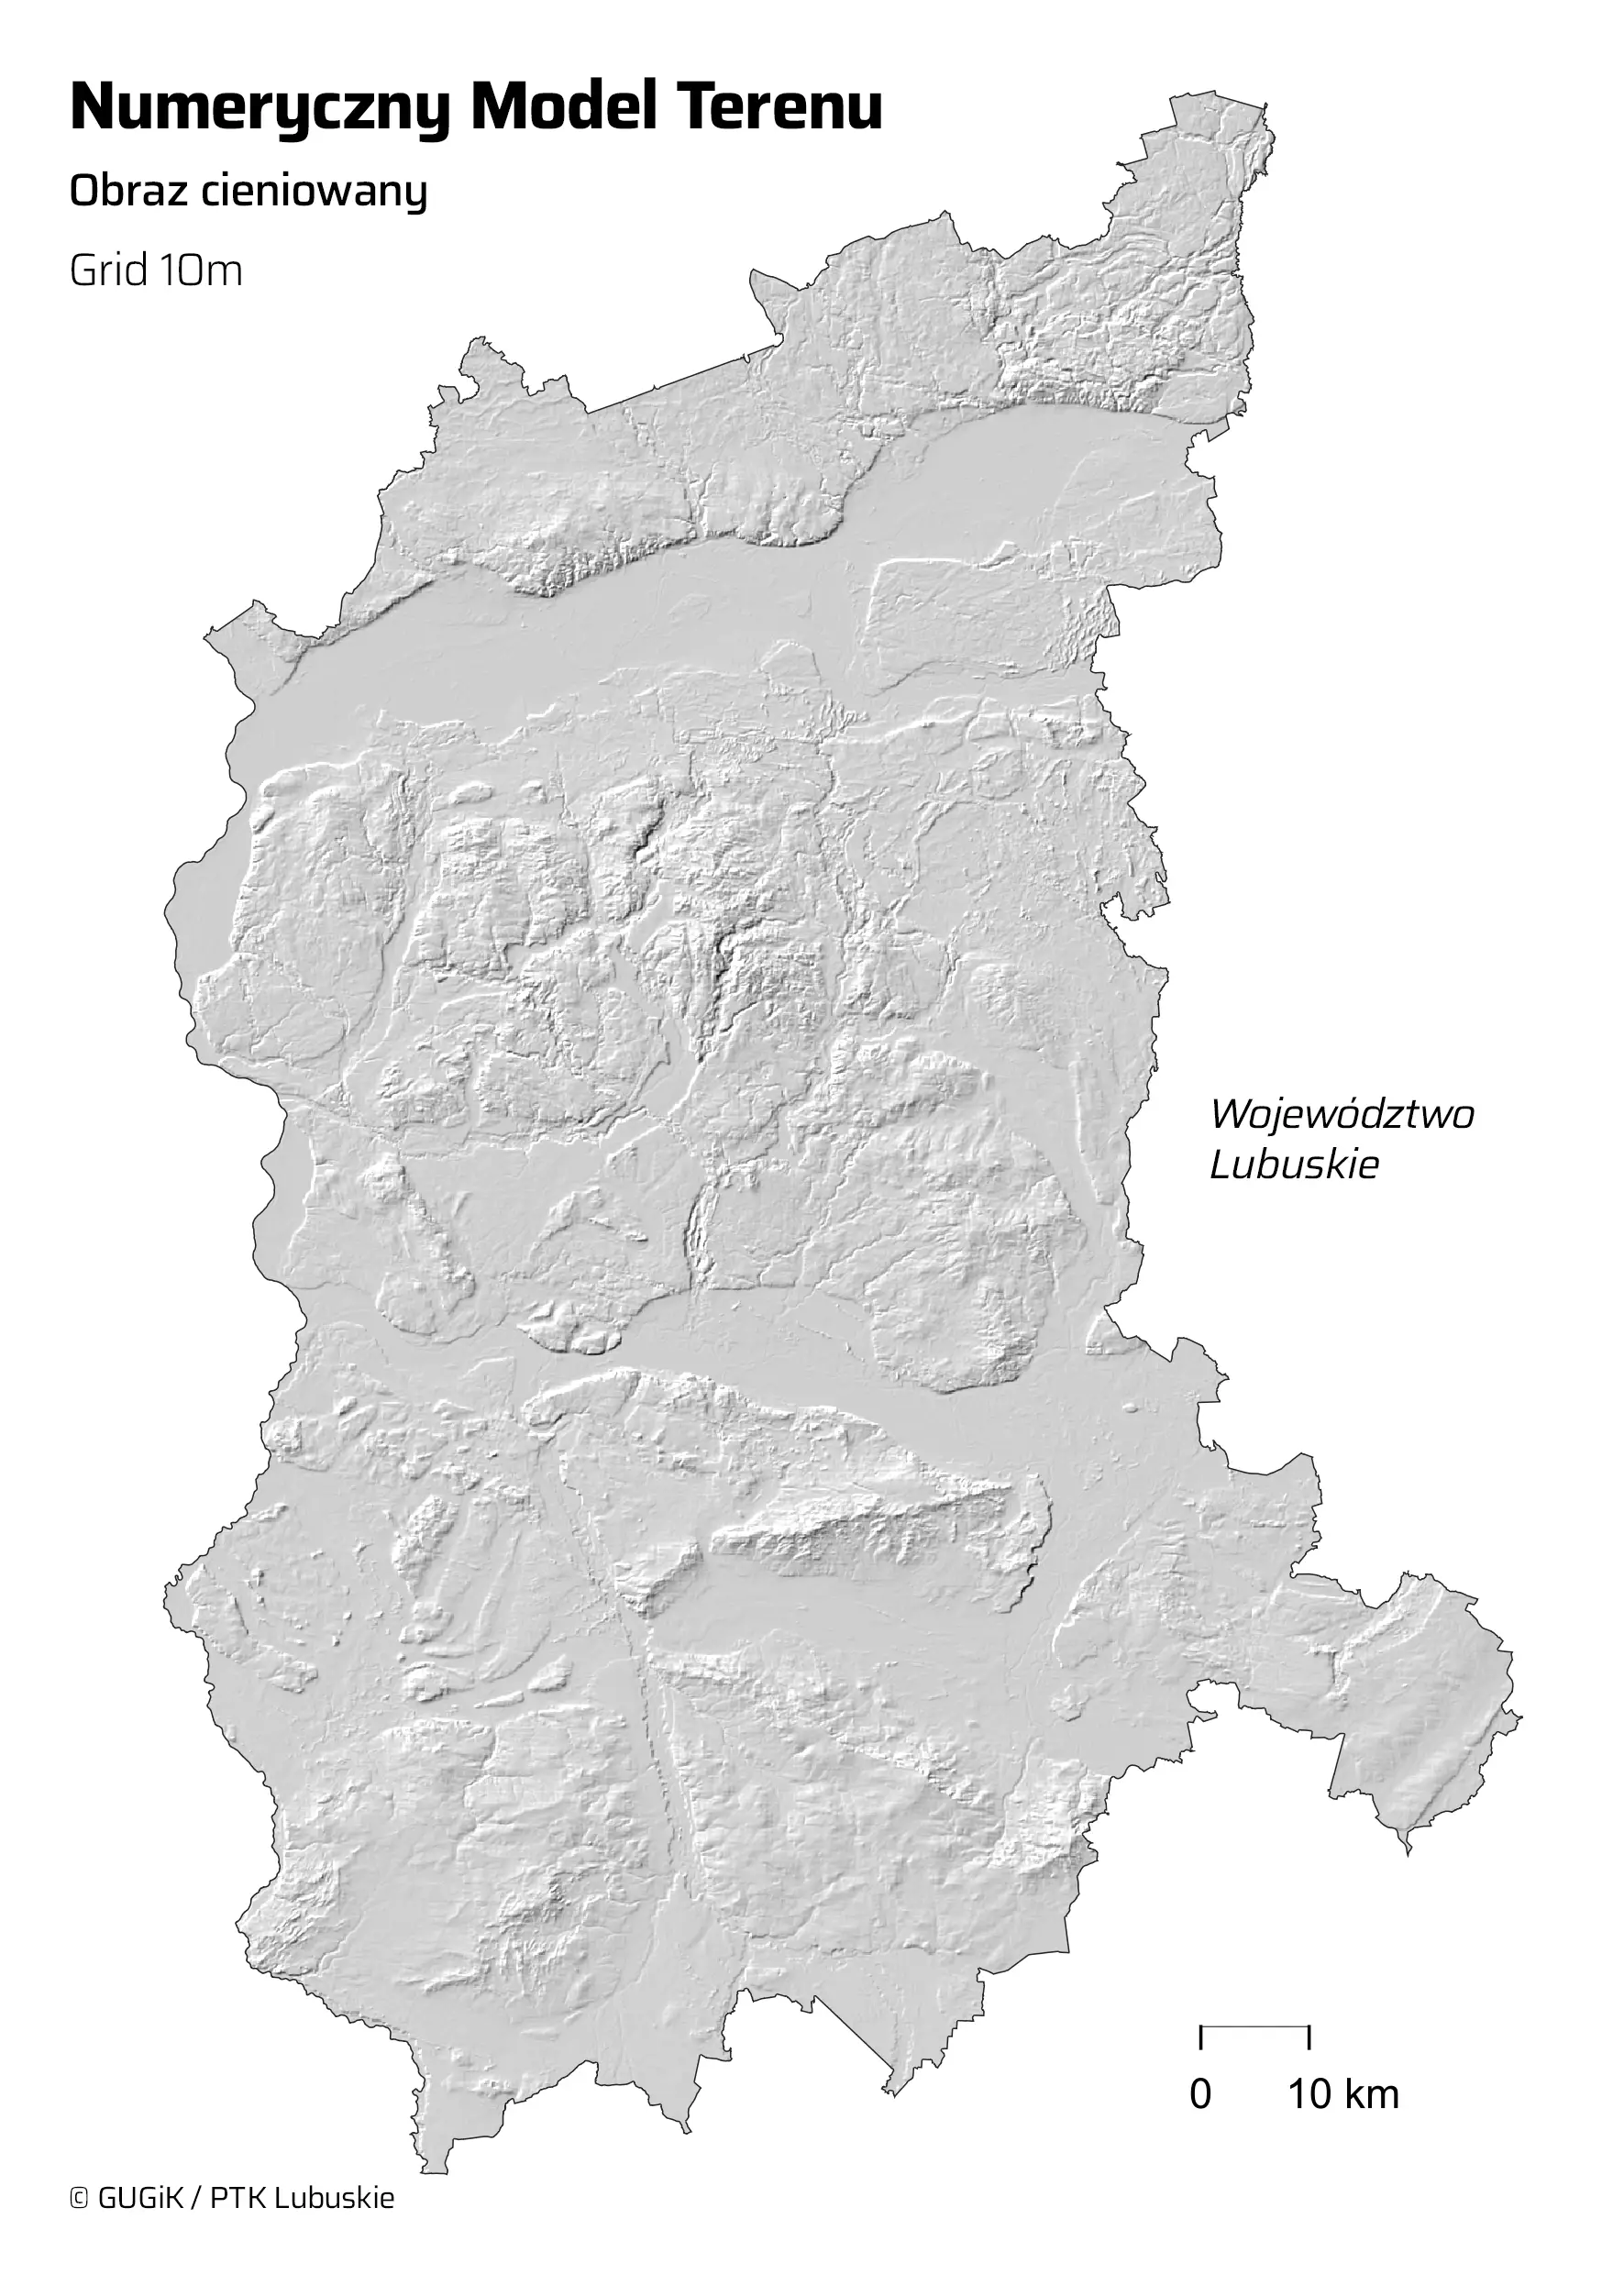
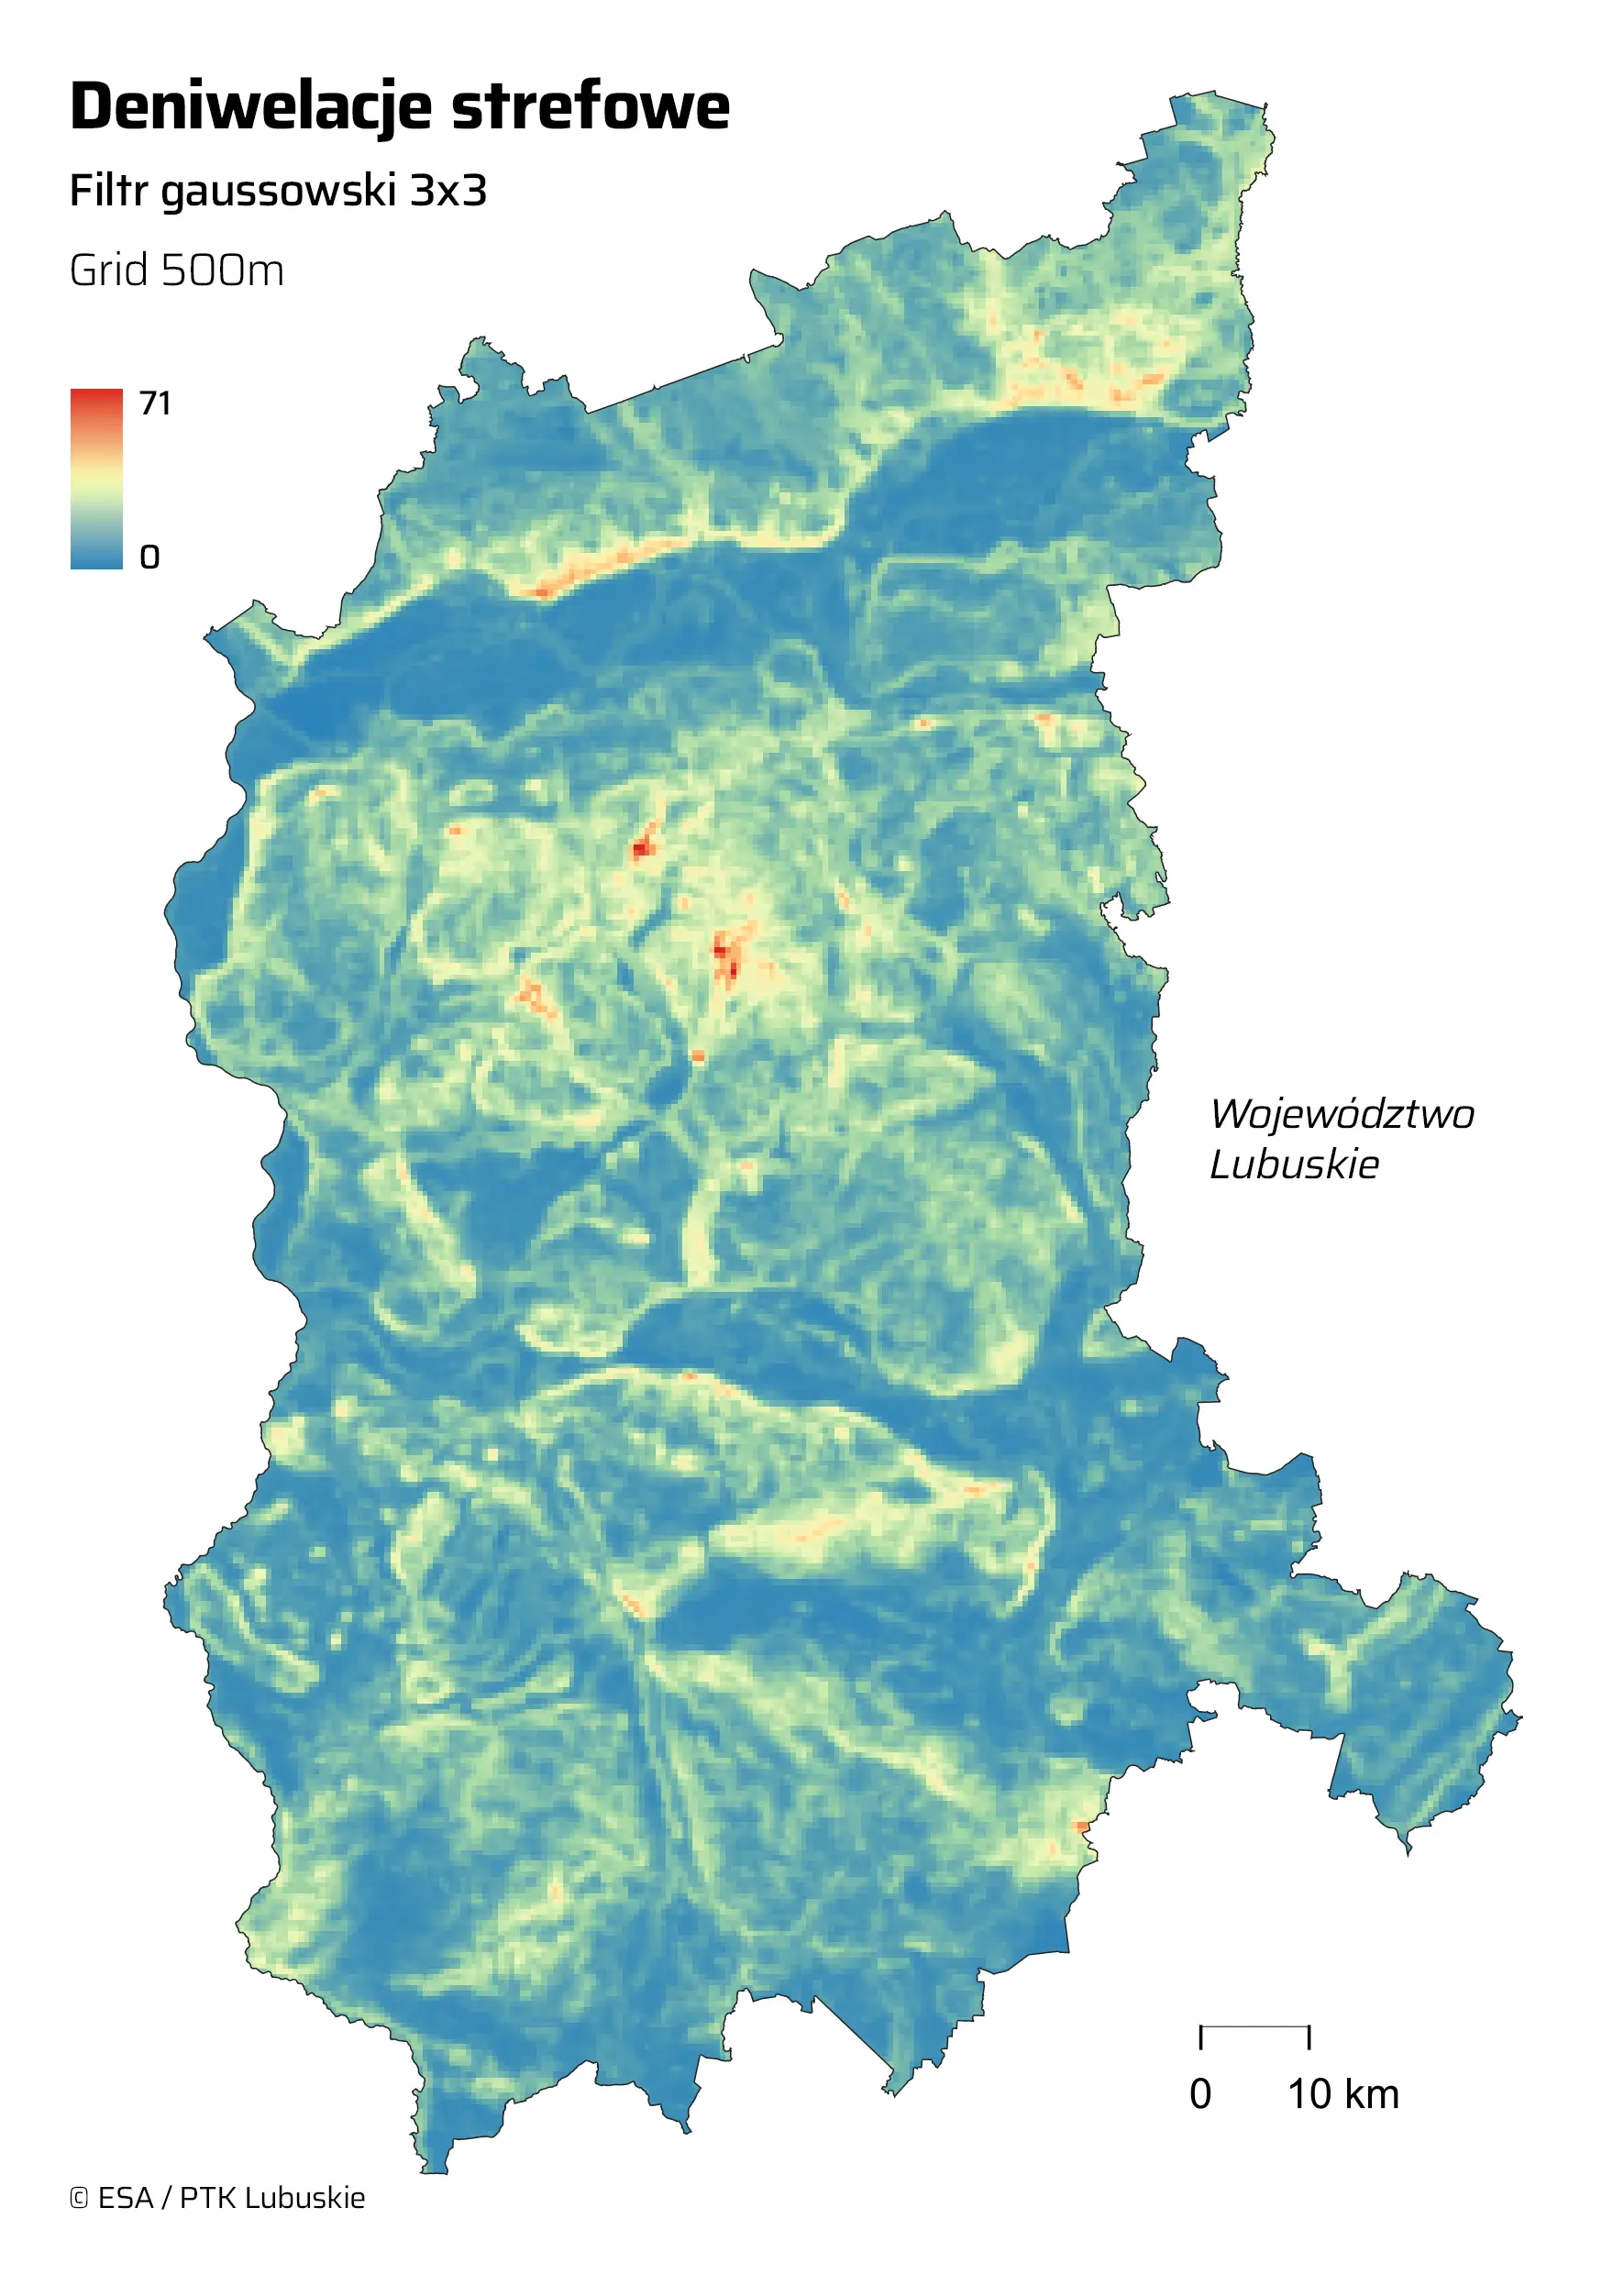
Fig. 4. Zonal elevation differences as a measure of the topographical diversity of the Lubuskie Voivodeship. Source: PTK Lubuskie
3.2.3. Variation in forest cover (F)
The presence of forests is regarded in many sources as an important criterion for landscape attractiveness. Given that the Lubuskie Voivodeship is the most forested region in Poland (50.8% of its total area in 2022, according to the Central Statistical Office), forest cover was adopted as an important component in the assessment of landscape quality. Naturally, not all forests are the same, and the mere criterion of their presence in a given area is insufficient for the analysis. Once again, diversity was adopted as a criterion, particularly as a rich set of high-resolution ‘forest’ products from the CLMS dataset comes to the fore here. The geodata available there includes:
- tree cover density (TCD),
- dominant leaf type (DLT),
- forest type (FT).
The analysis utilised a rasterised DLT dataset with a ground-truth pixel size of 10 m (2023), which was downloaded in sections, merged and cropped to the provincial boundaries with a 500 m buffer. This data was subjected to specialised filtering – the calculation of the Shannon index. As in the LC analysis, a cross-kernel with a radius of 50 pixels was used.
The range of the output data for the Shannon diversity index raster is clearly smaller here [0…0.69]. This is due to the small number of input classes, limited to two. However, once again, we are interested in the relative values and the spatial distribution of the feature.
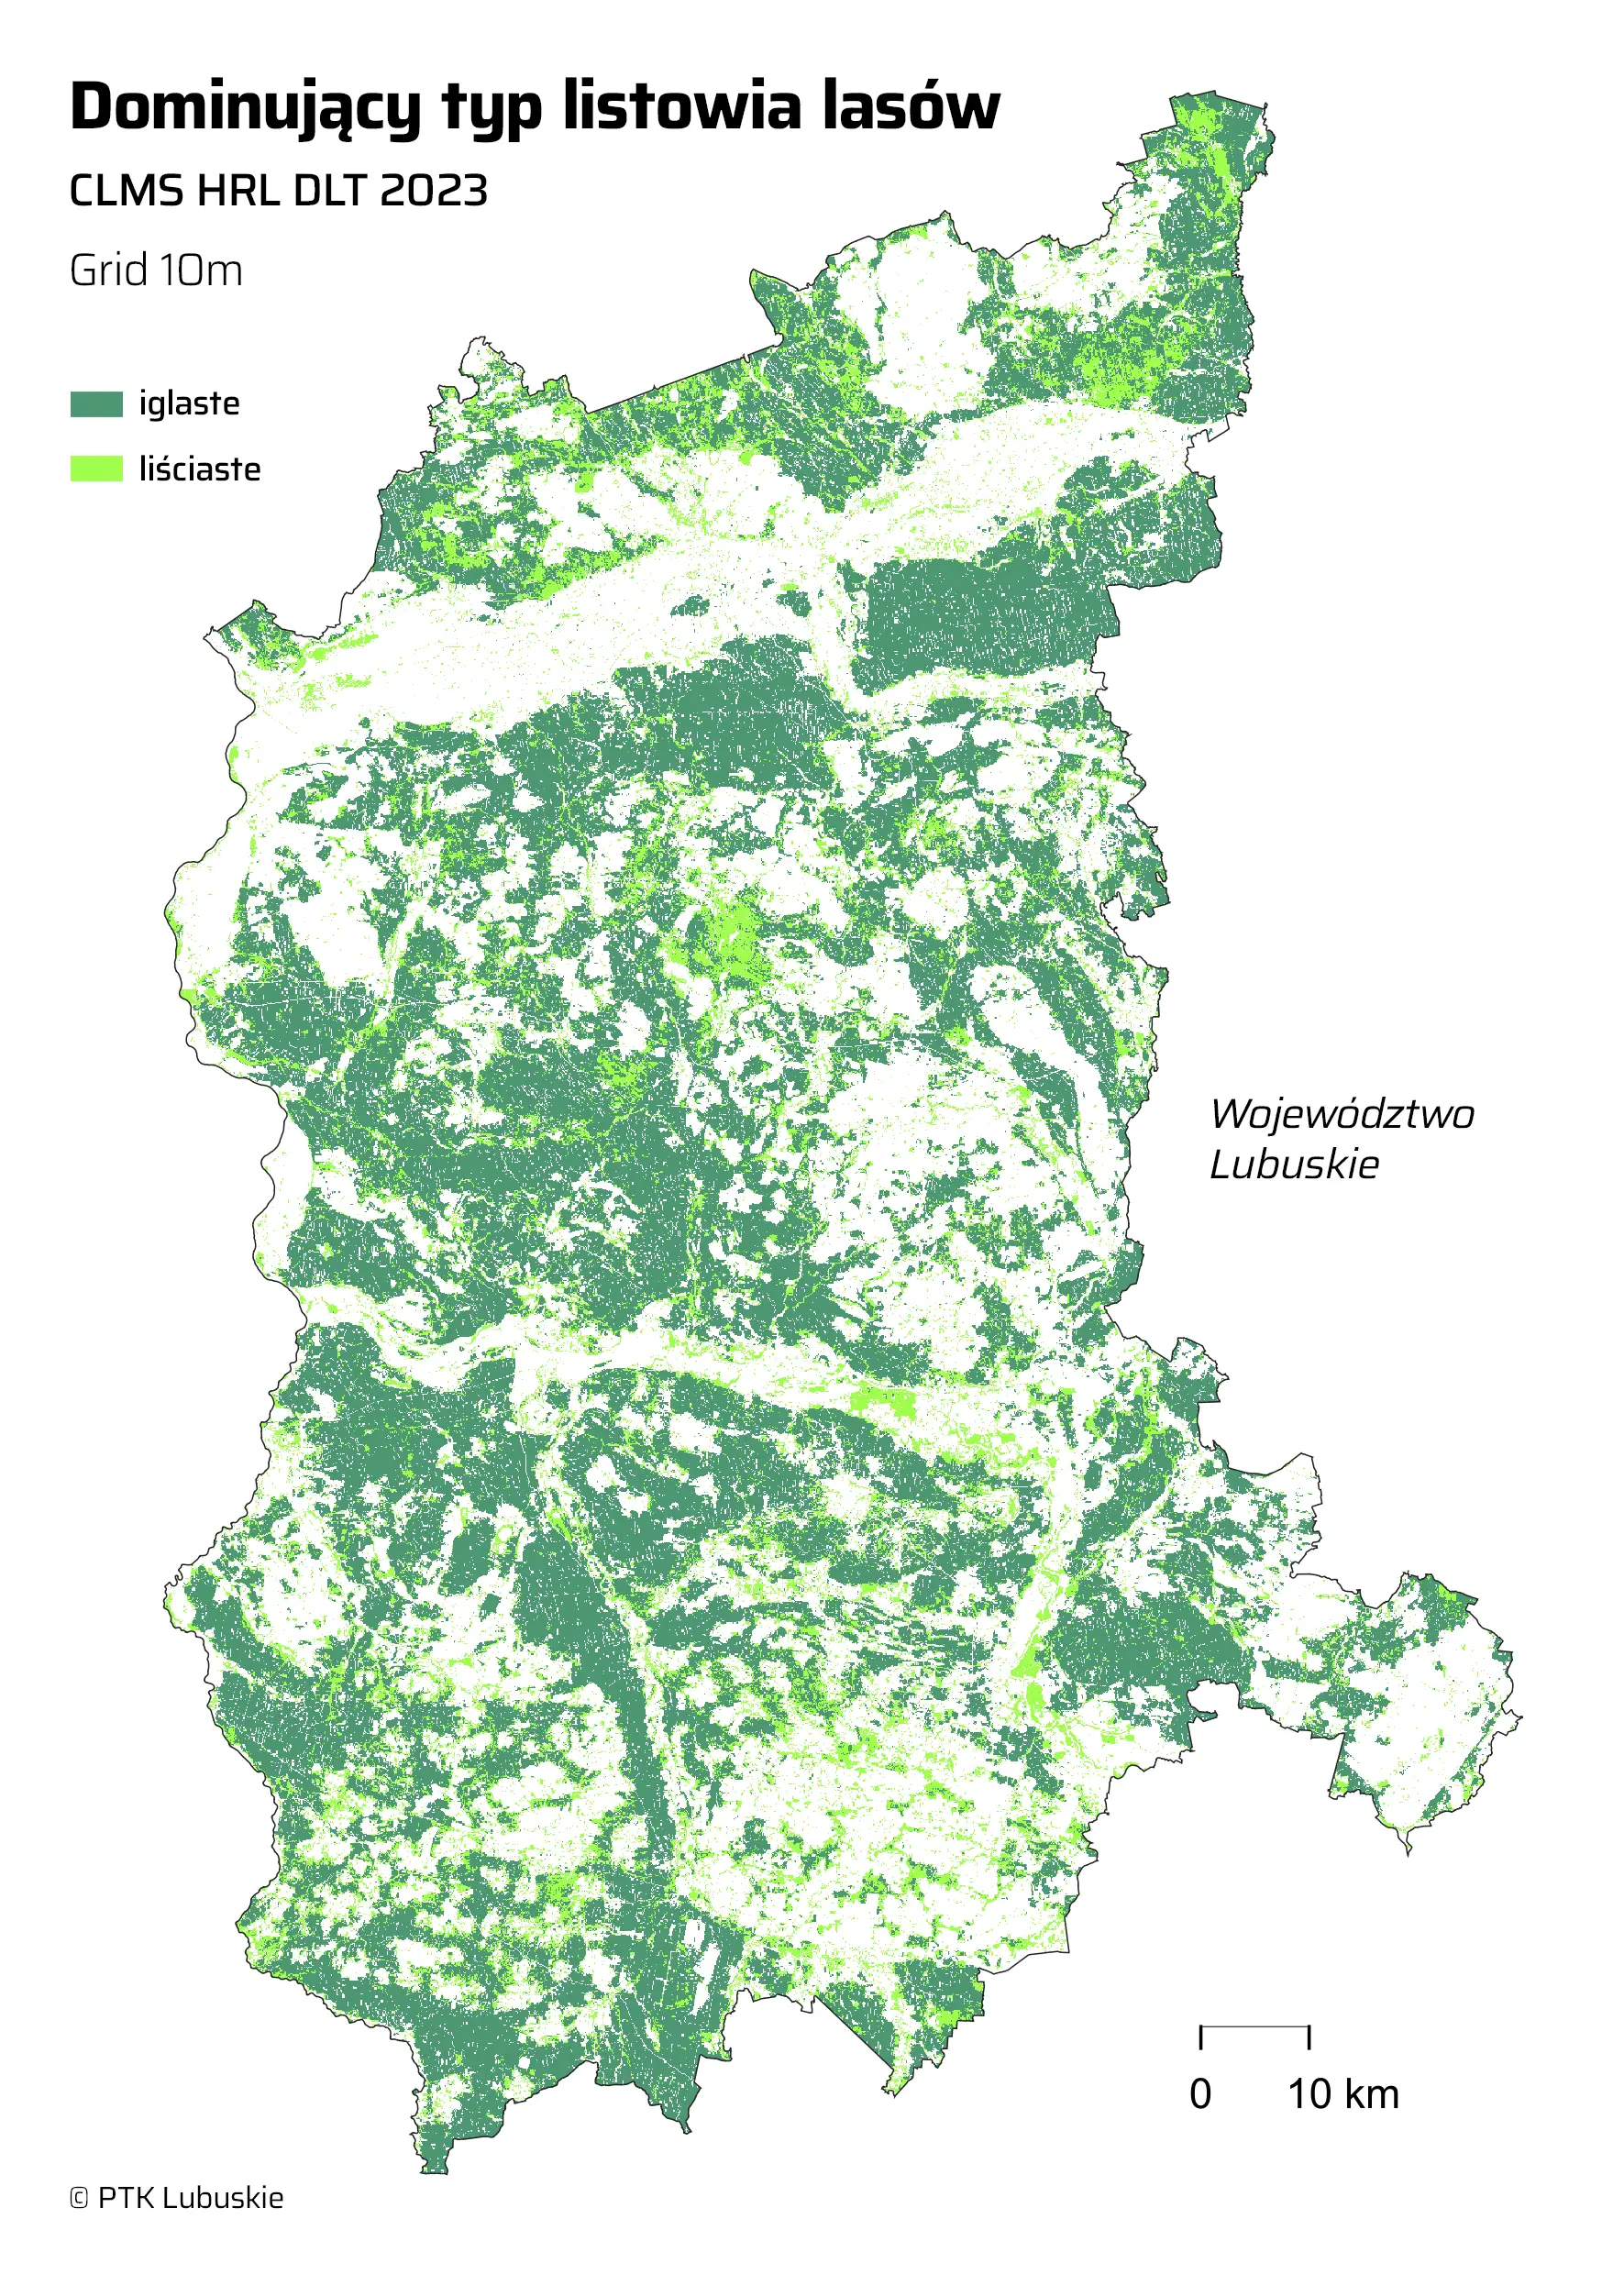
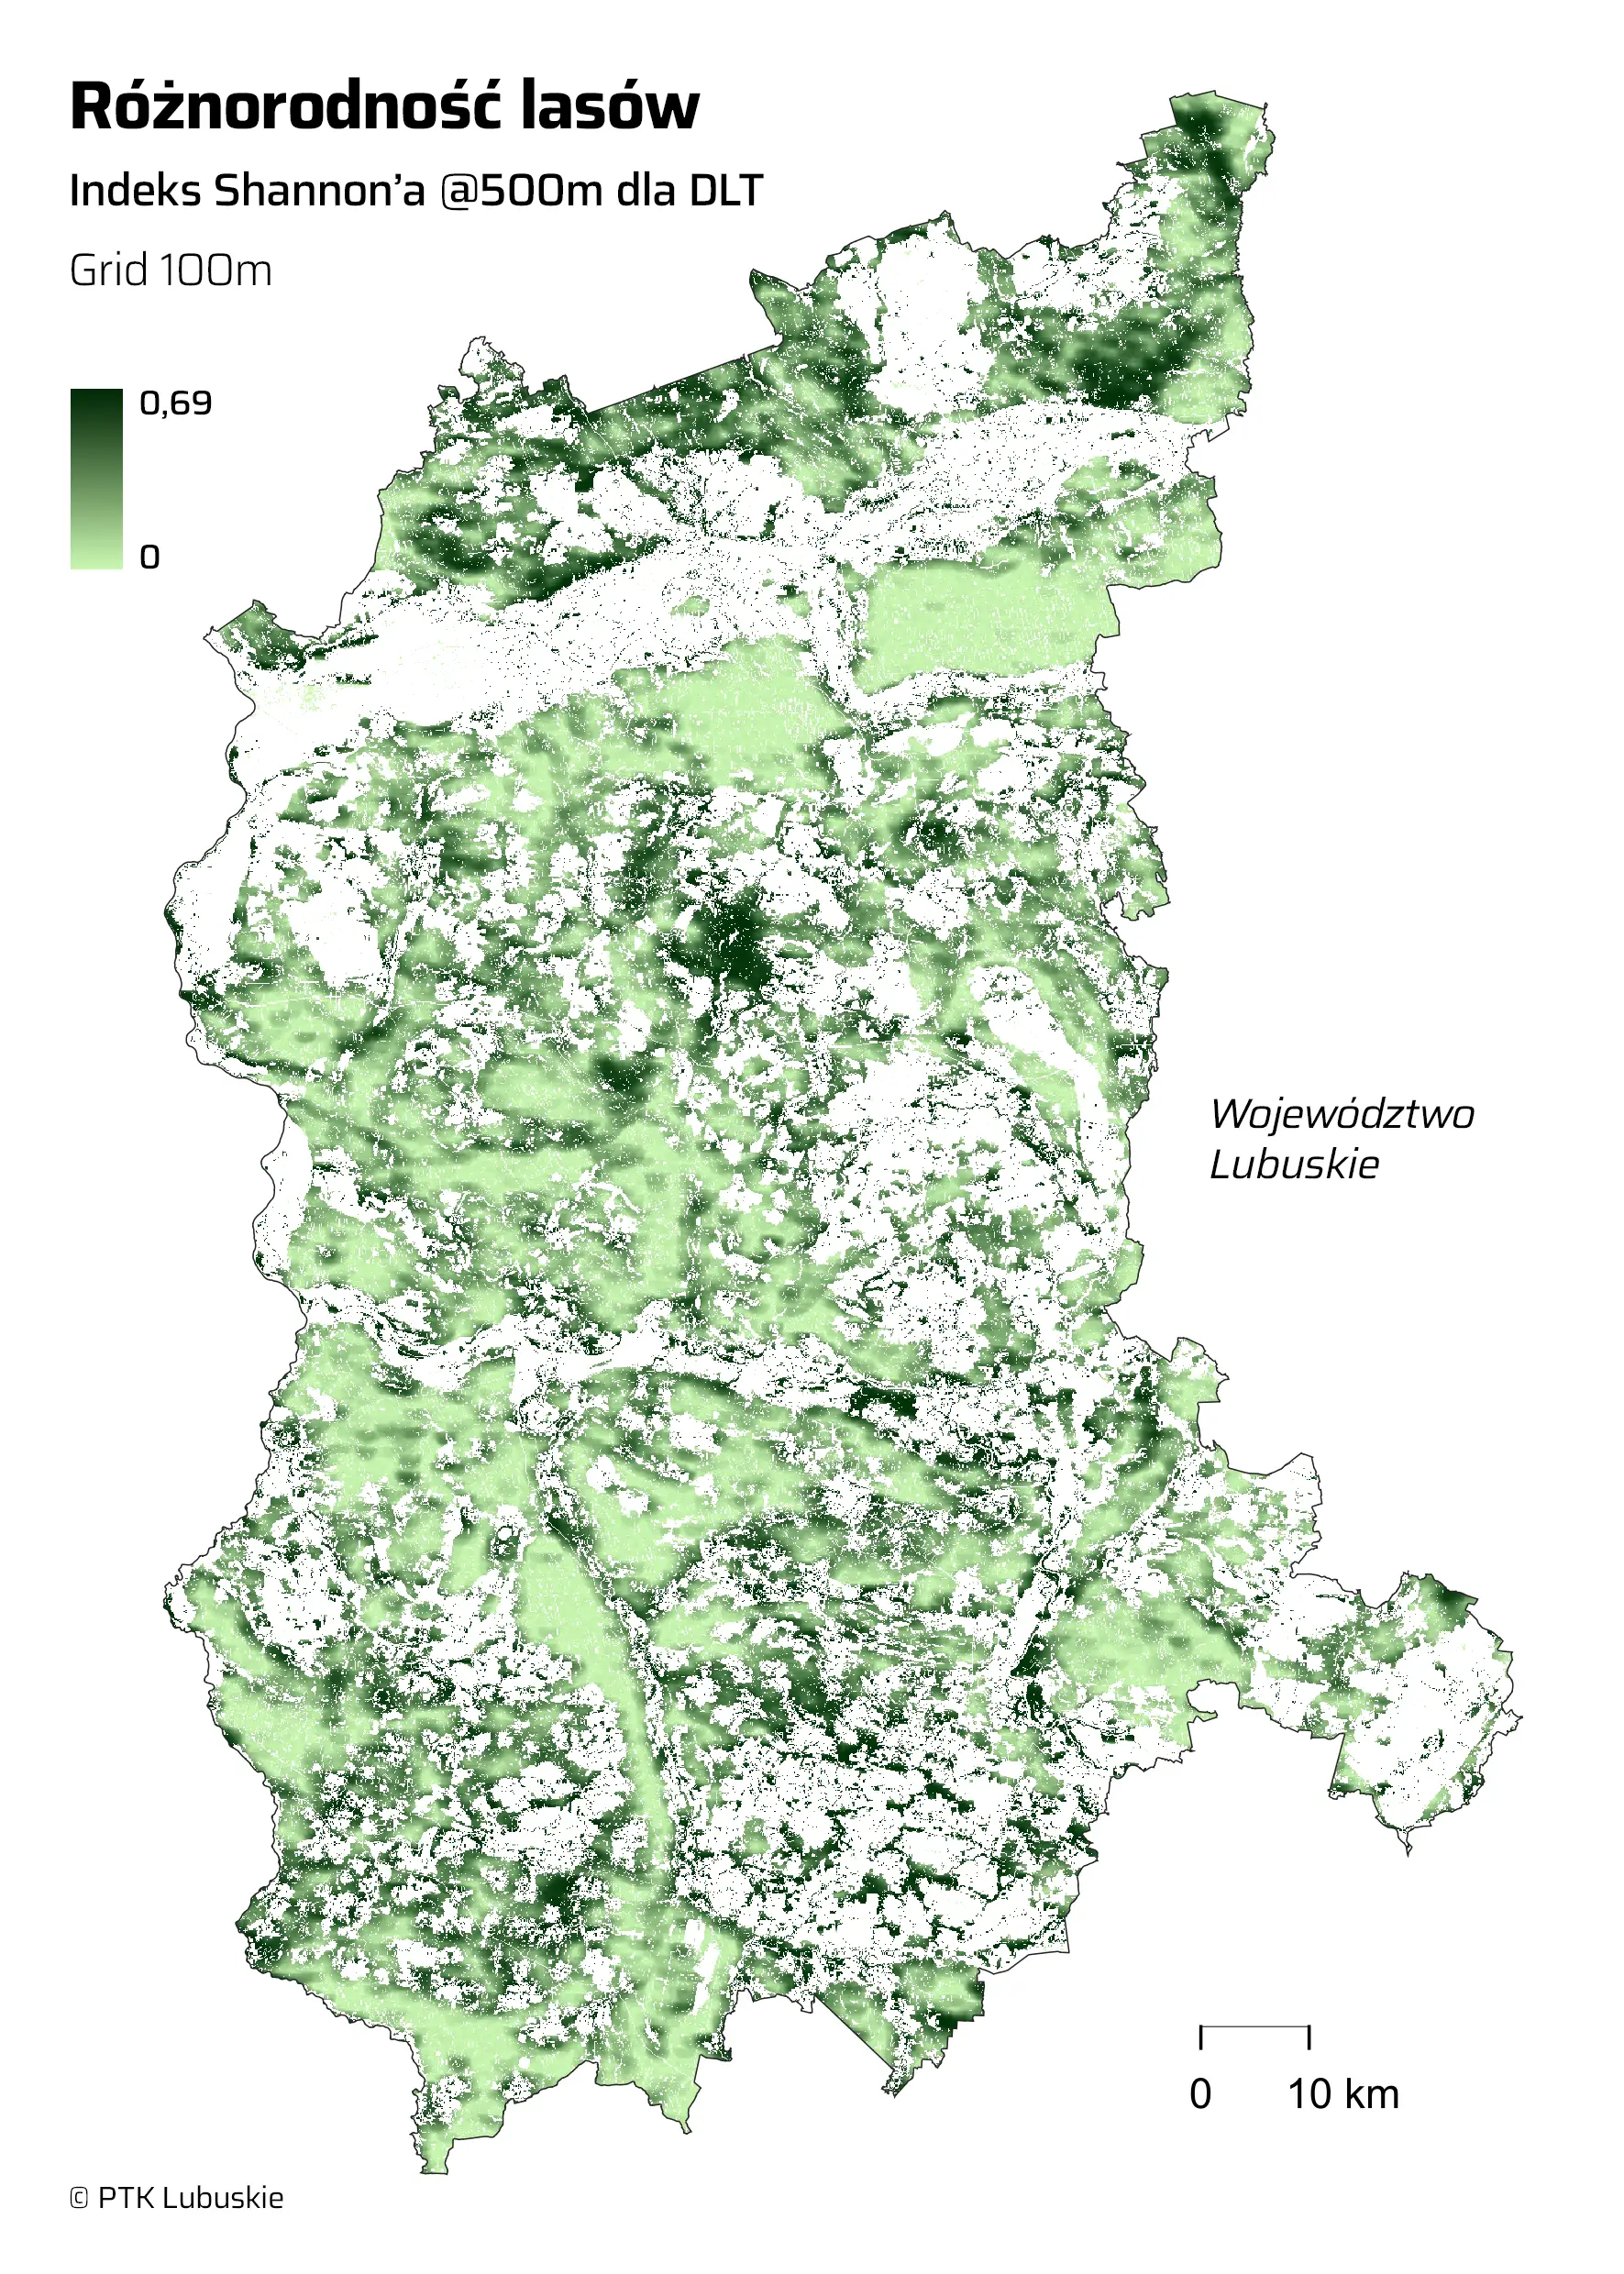
Fig. 5. Forest diversity in the Lubuskie Voivodeship. Source: PTK Lubuskie
3.2.4. The presence of positive landscape modifiers (M)
In addition to the analytical components outlined above, it was decided to expand the analysis to include further elements affecting landscape attractiveness, based on the thematic layers available on the CLMS website, corresponding to:
- Water & Wetness (WW),
- Herbaceous meadows and pastures (H+G),
- Density of small landscape features (SWF).
Permanent water bodies were extracted from the WW raster layer (10 m), a buffer of 500 metres was applied, and the data was upscaled from 1-bit to 8-bit format, with the pixel value set to 100. It was then subjected to a 9×9 Gaussian filter, producing a ‘blurred’ image in the range [0…100].
The G and SWF layers required no processing, apart from being rescaled to ranges suitable for weighting. The H and G layers were summed, and the result was rescaled to [0…50]. The values of the SWF layer were rescaled to the same range.
As water is the most important component in this set, it has been given priority in the construction of the trait measure. The following weights have been assigned to the final layers:
WW(4) + HG(2) + SWF(1)
and by combining their previously defined value ranges, a final raster was obtained that met the above criteria. The result was subjected to a 3×3 Gaussian filter.
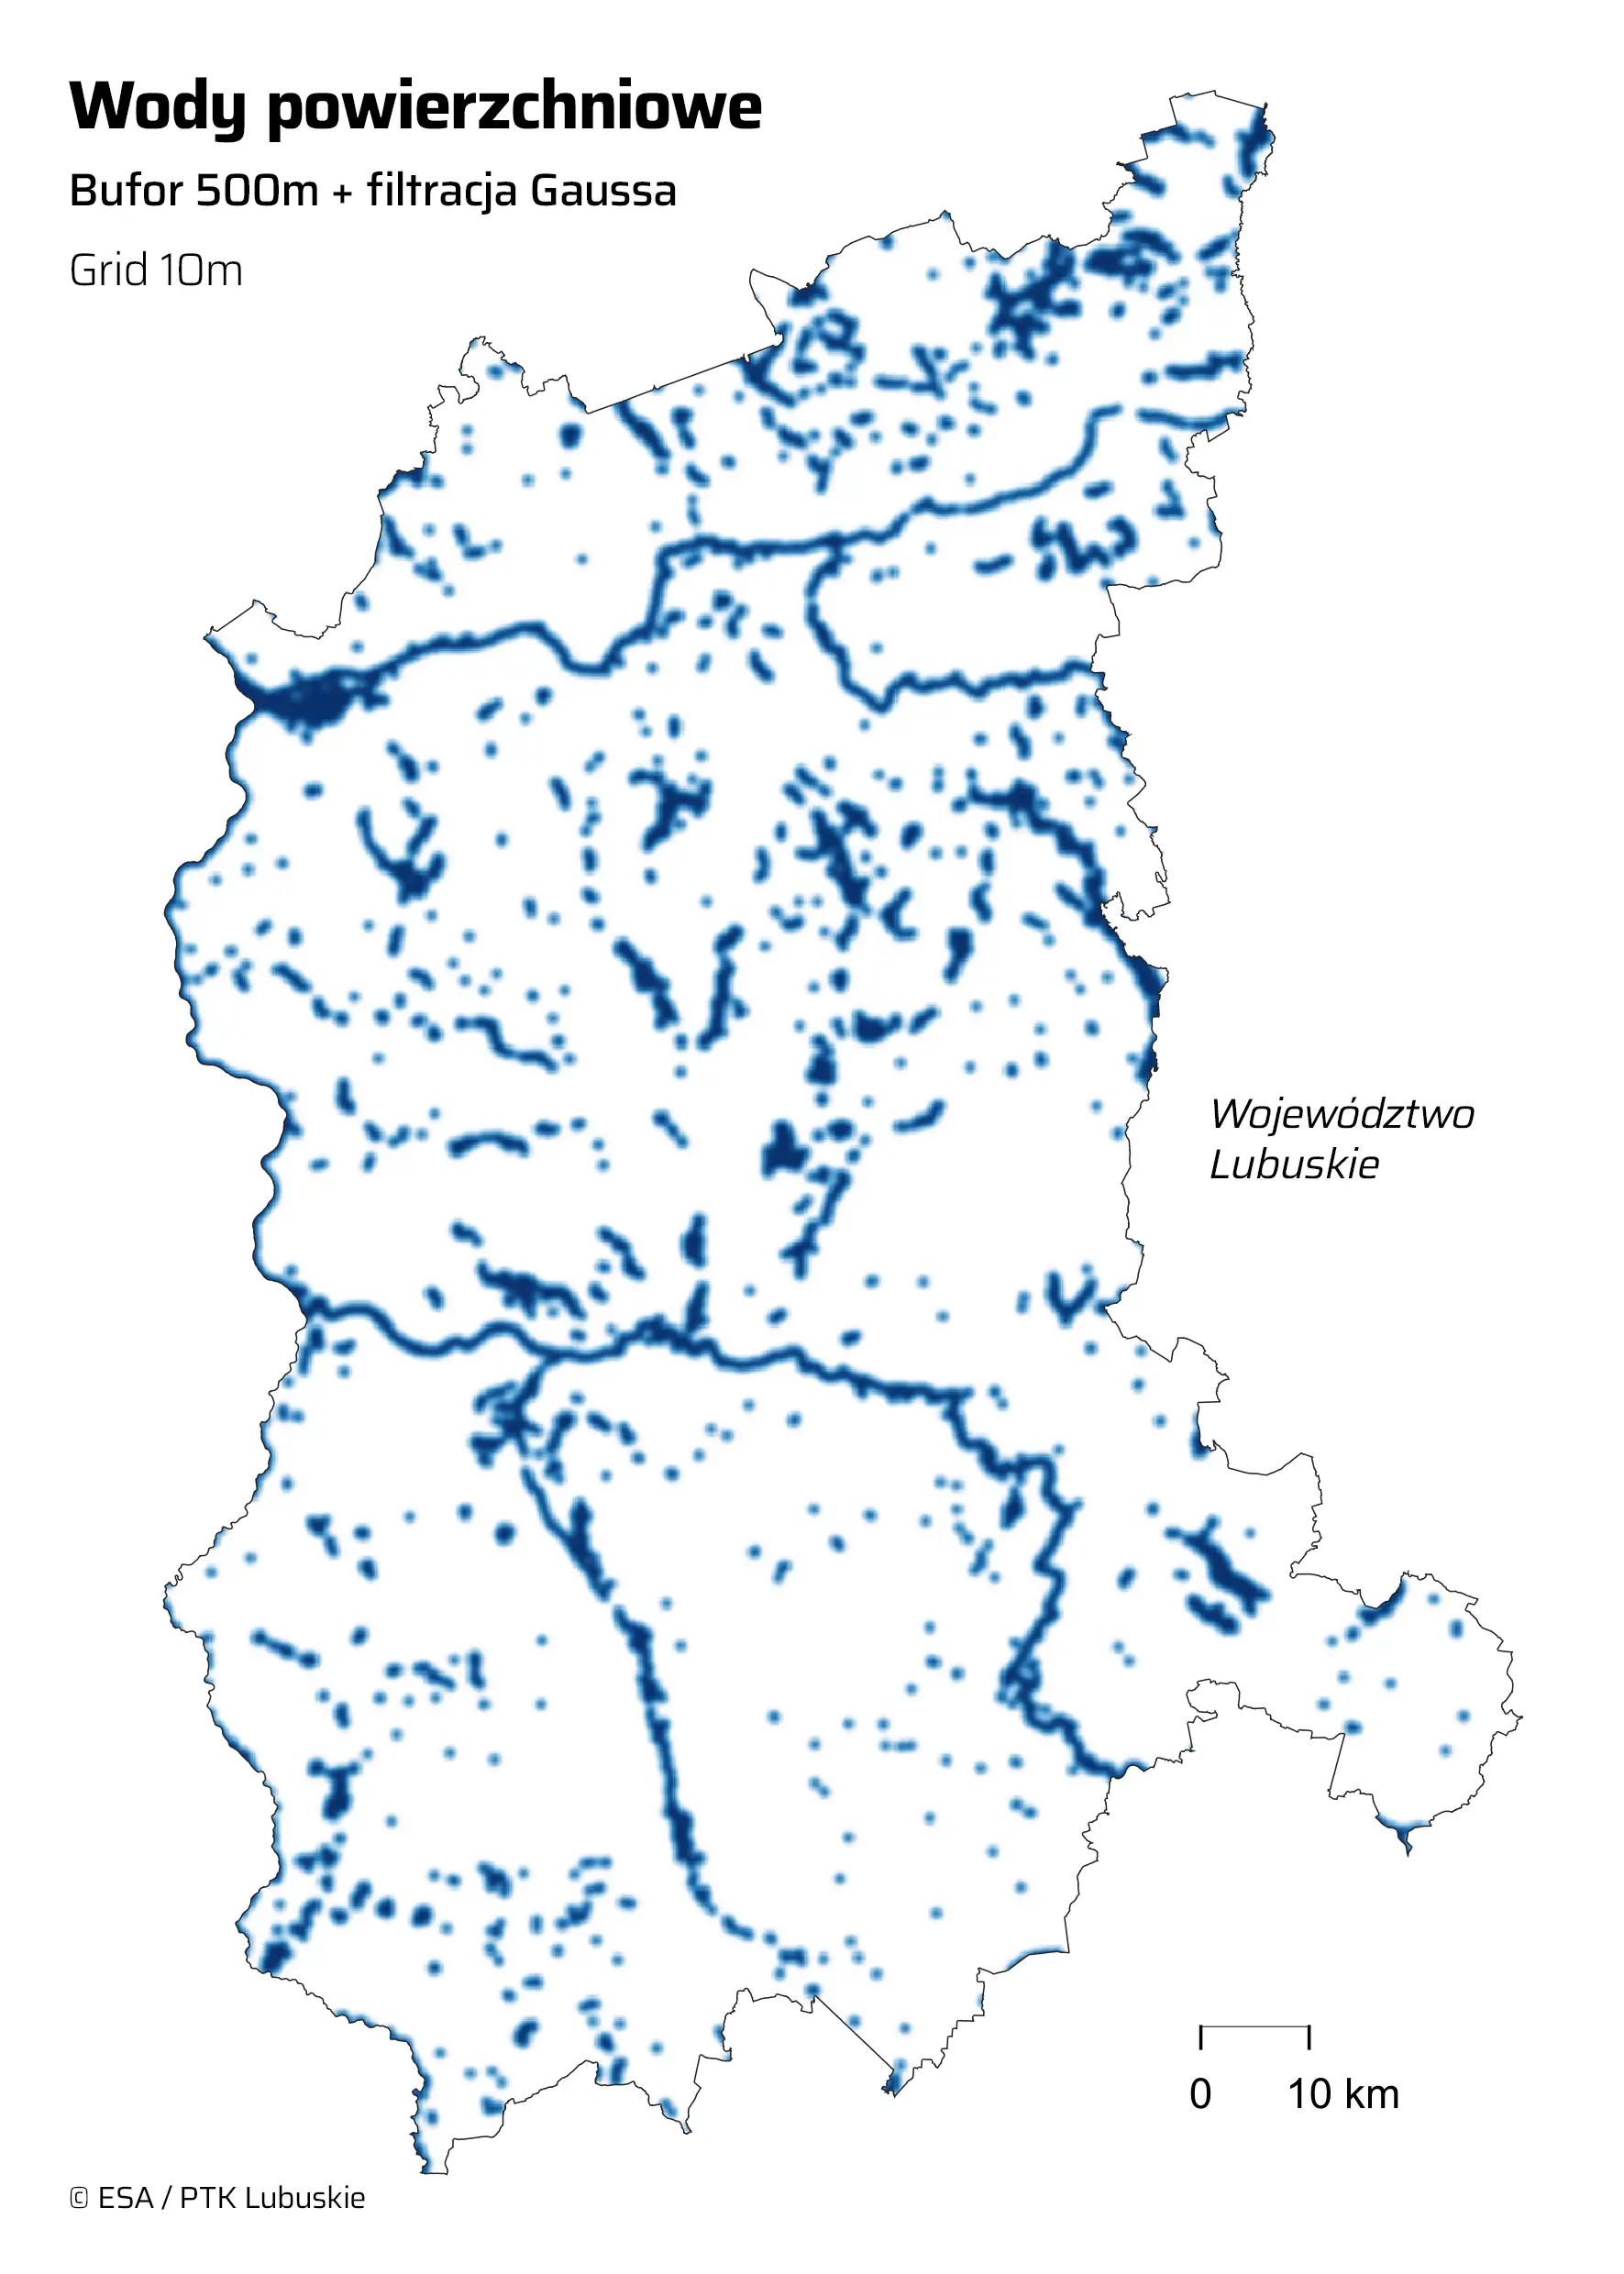
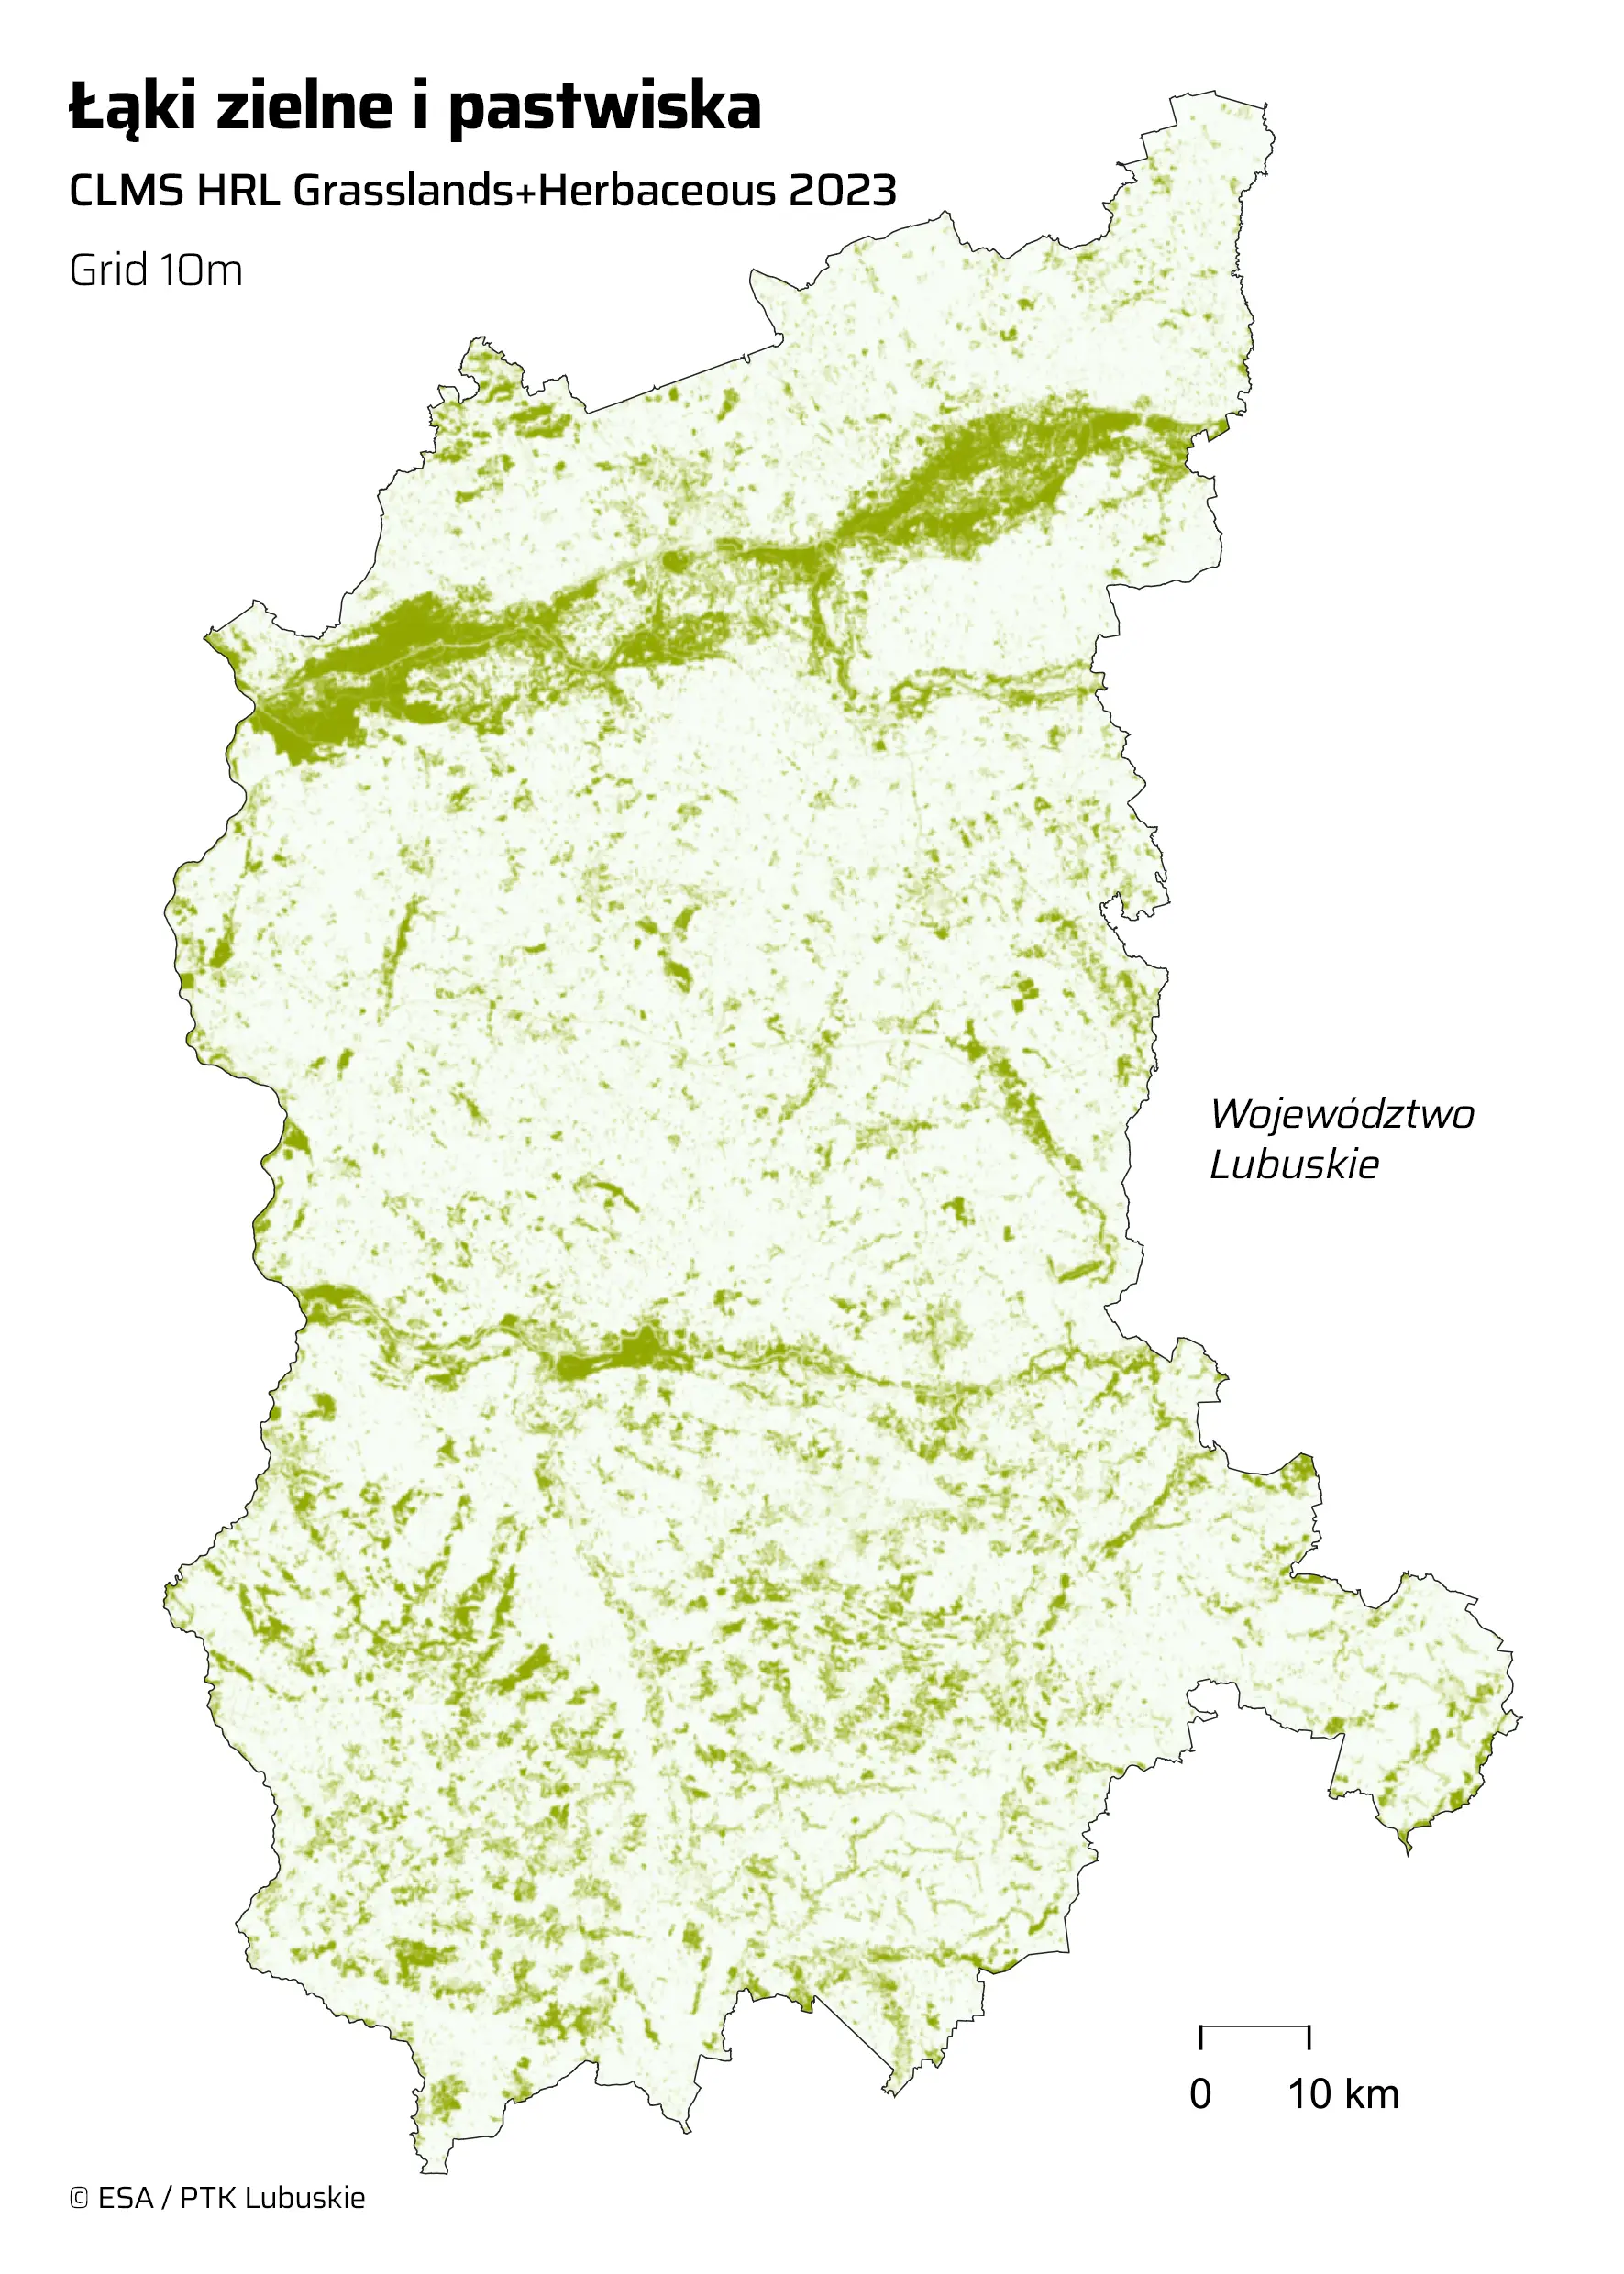
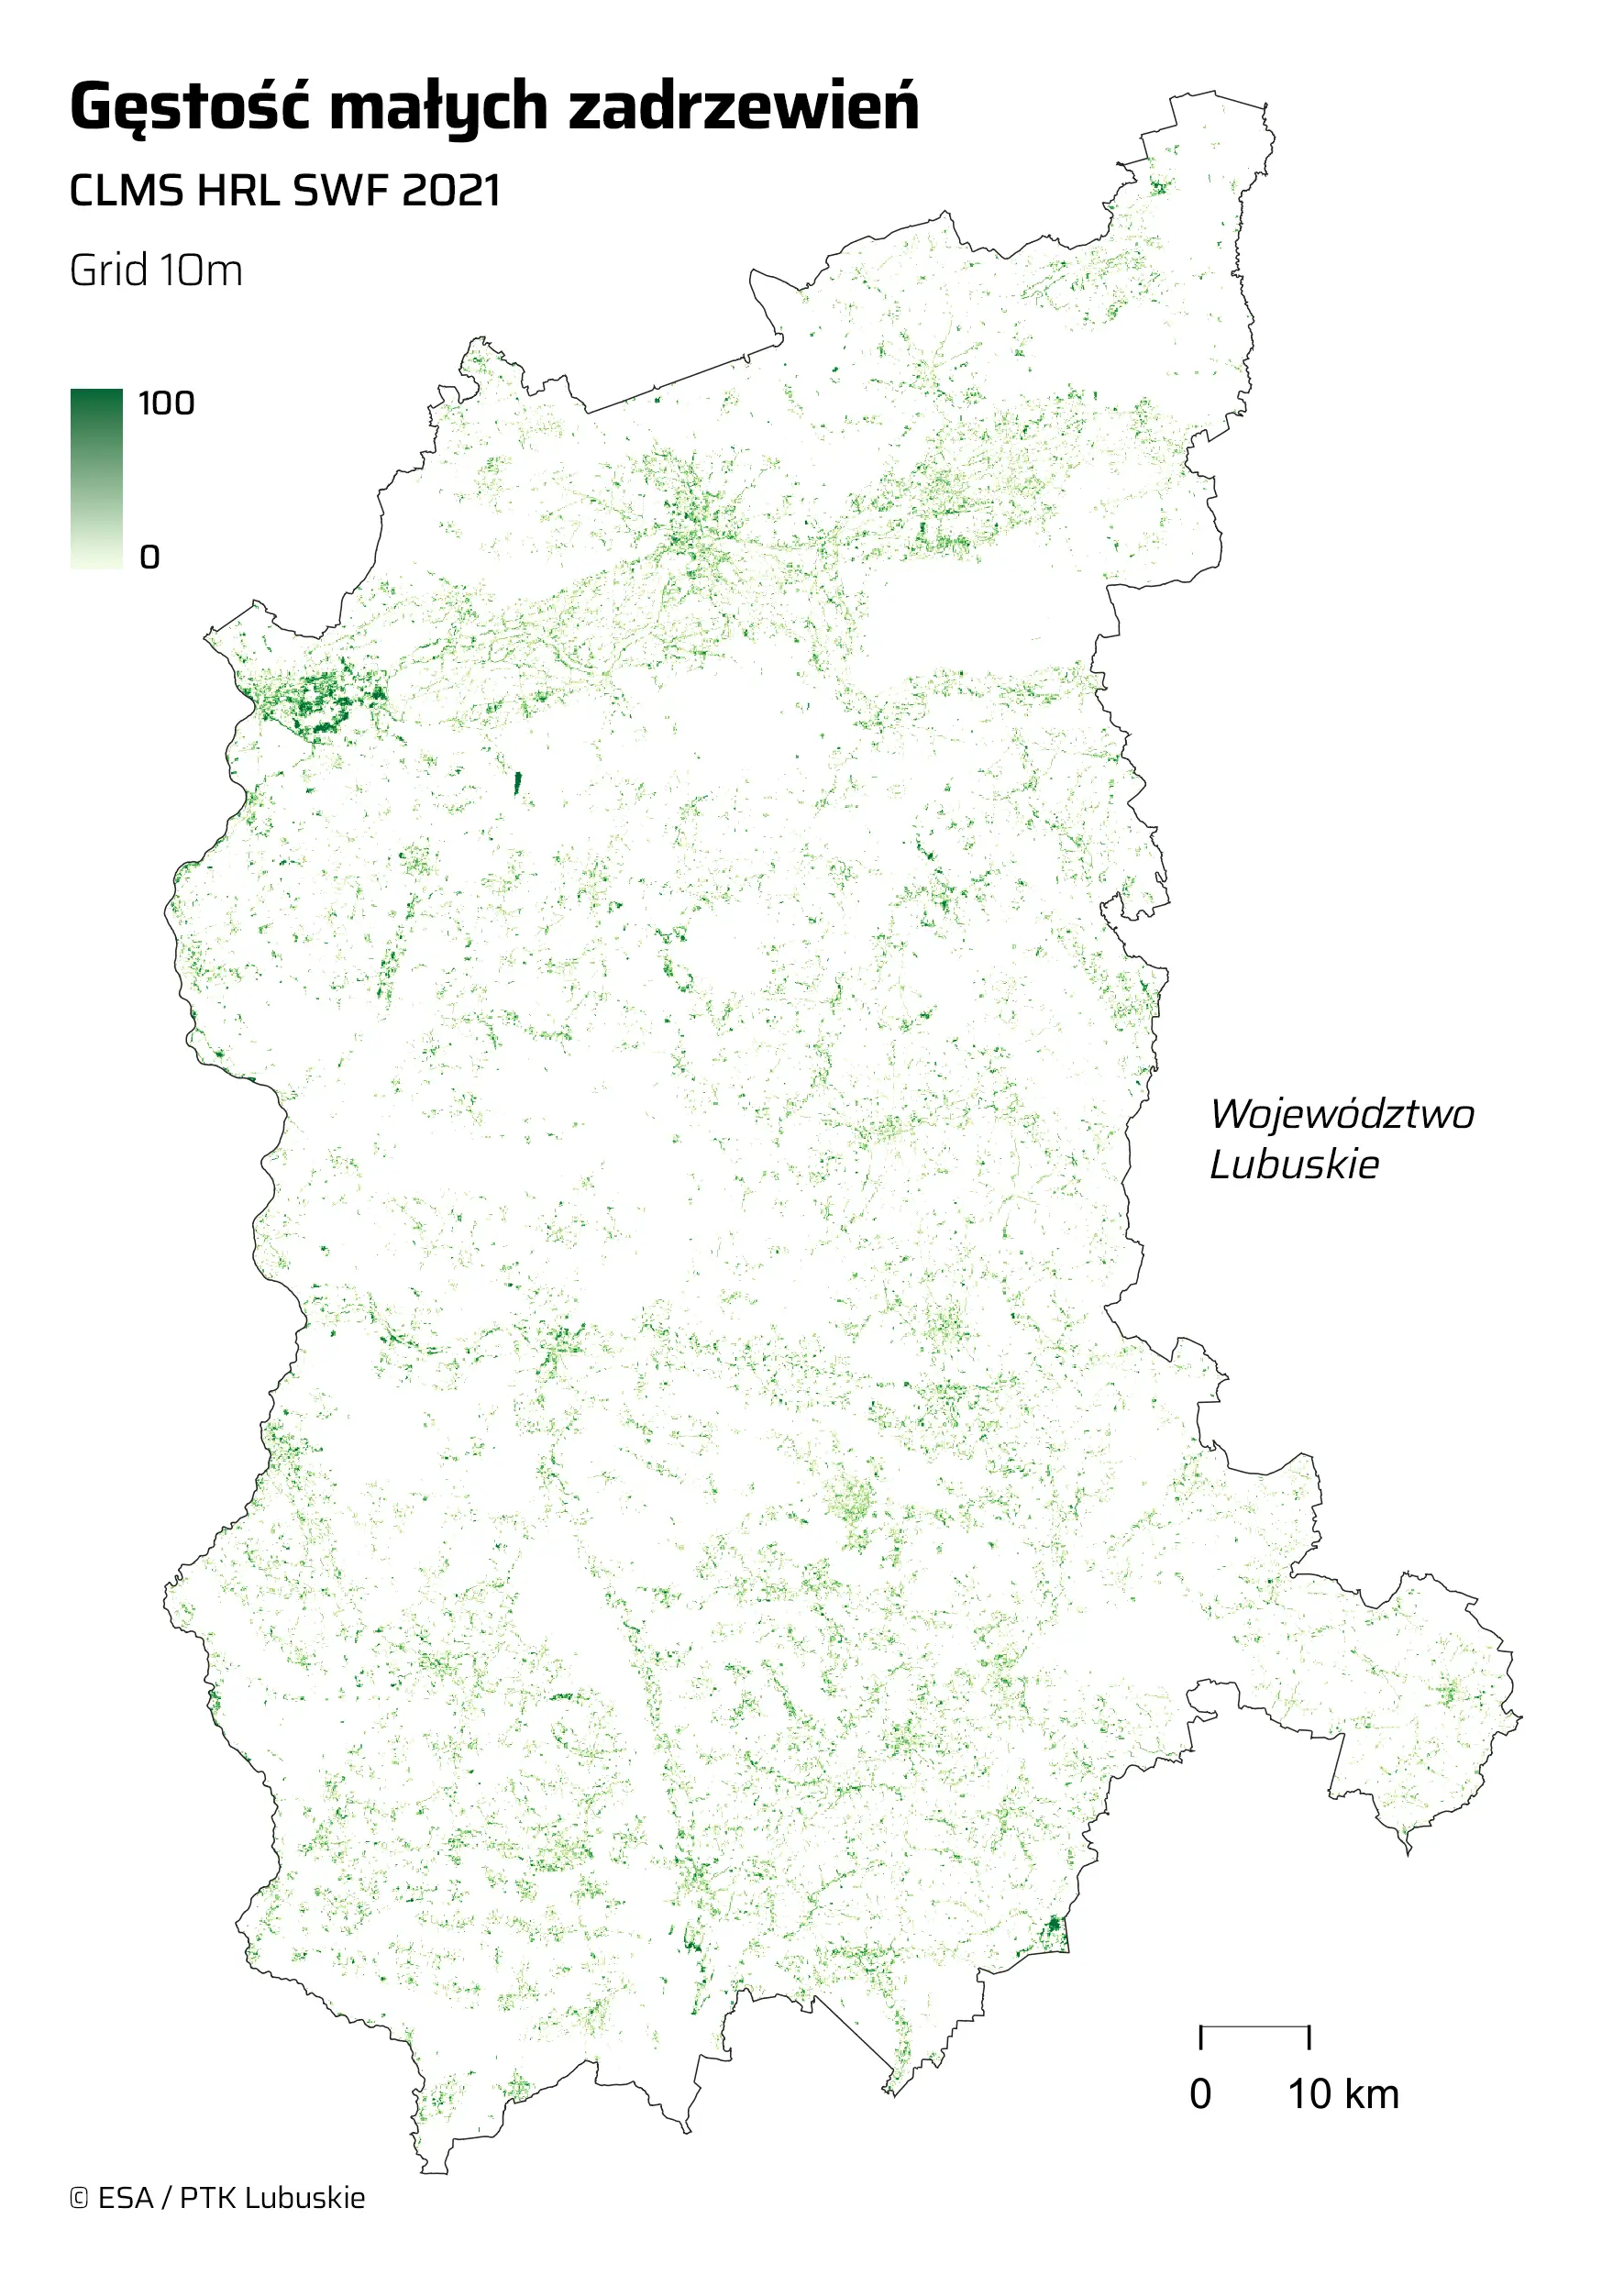
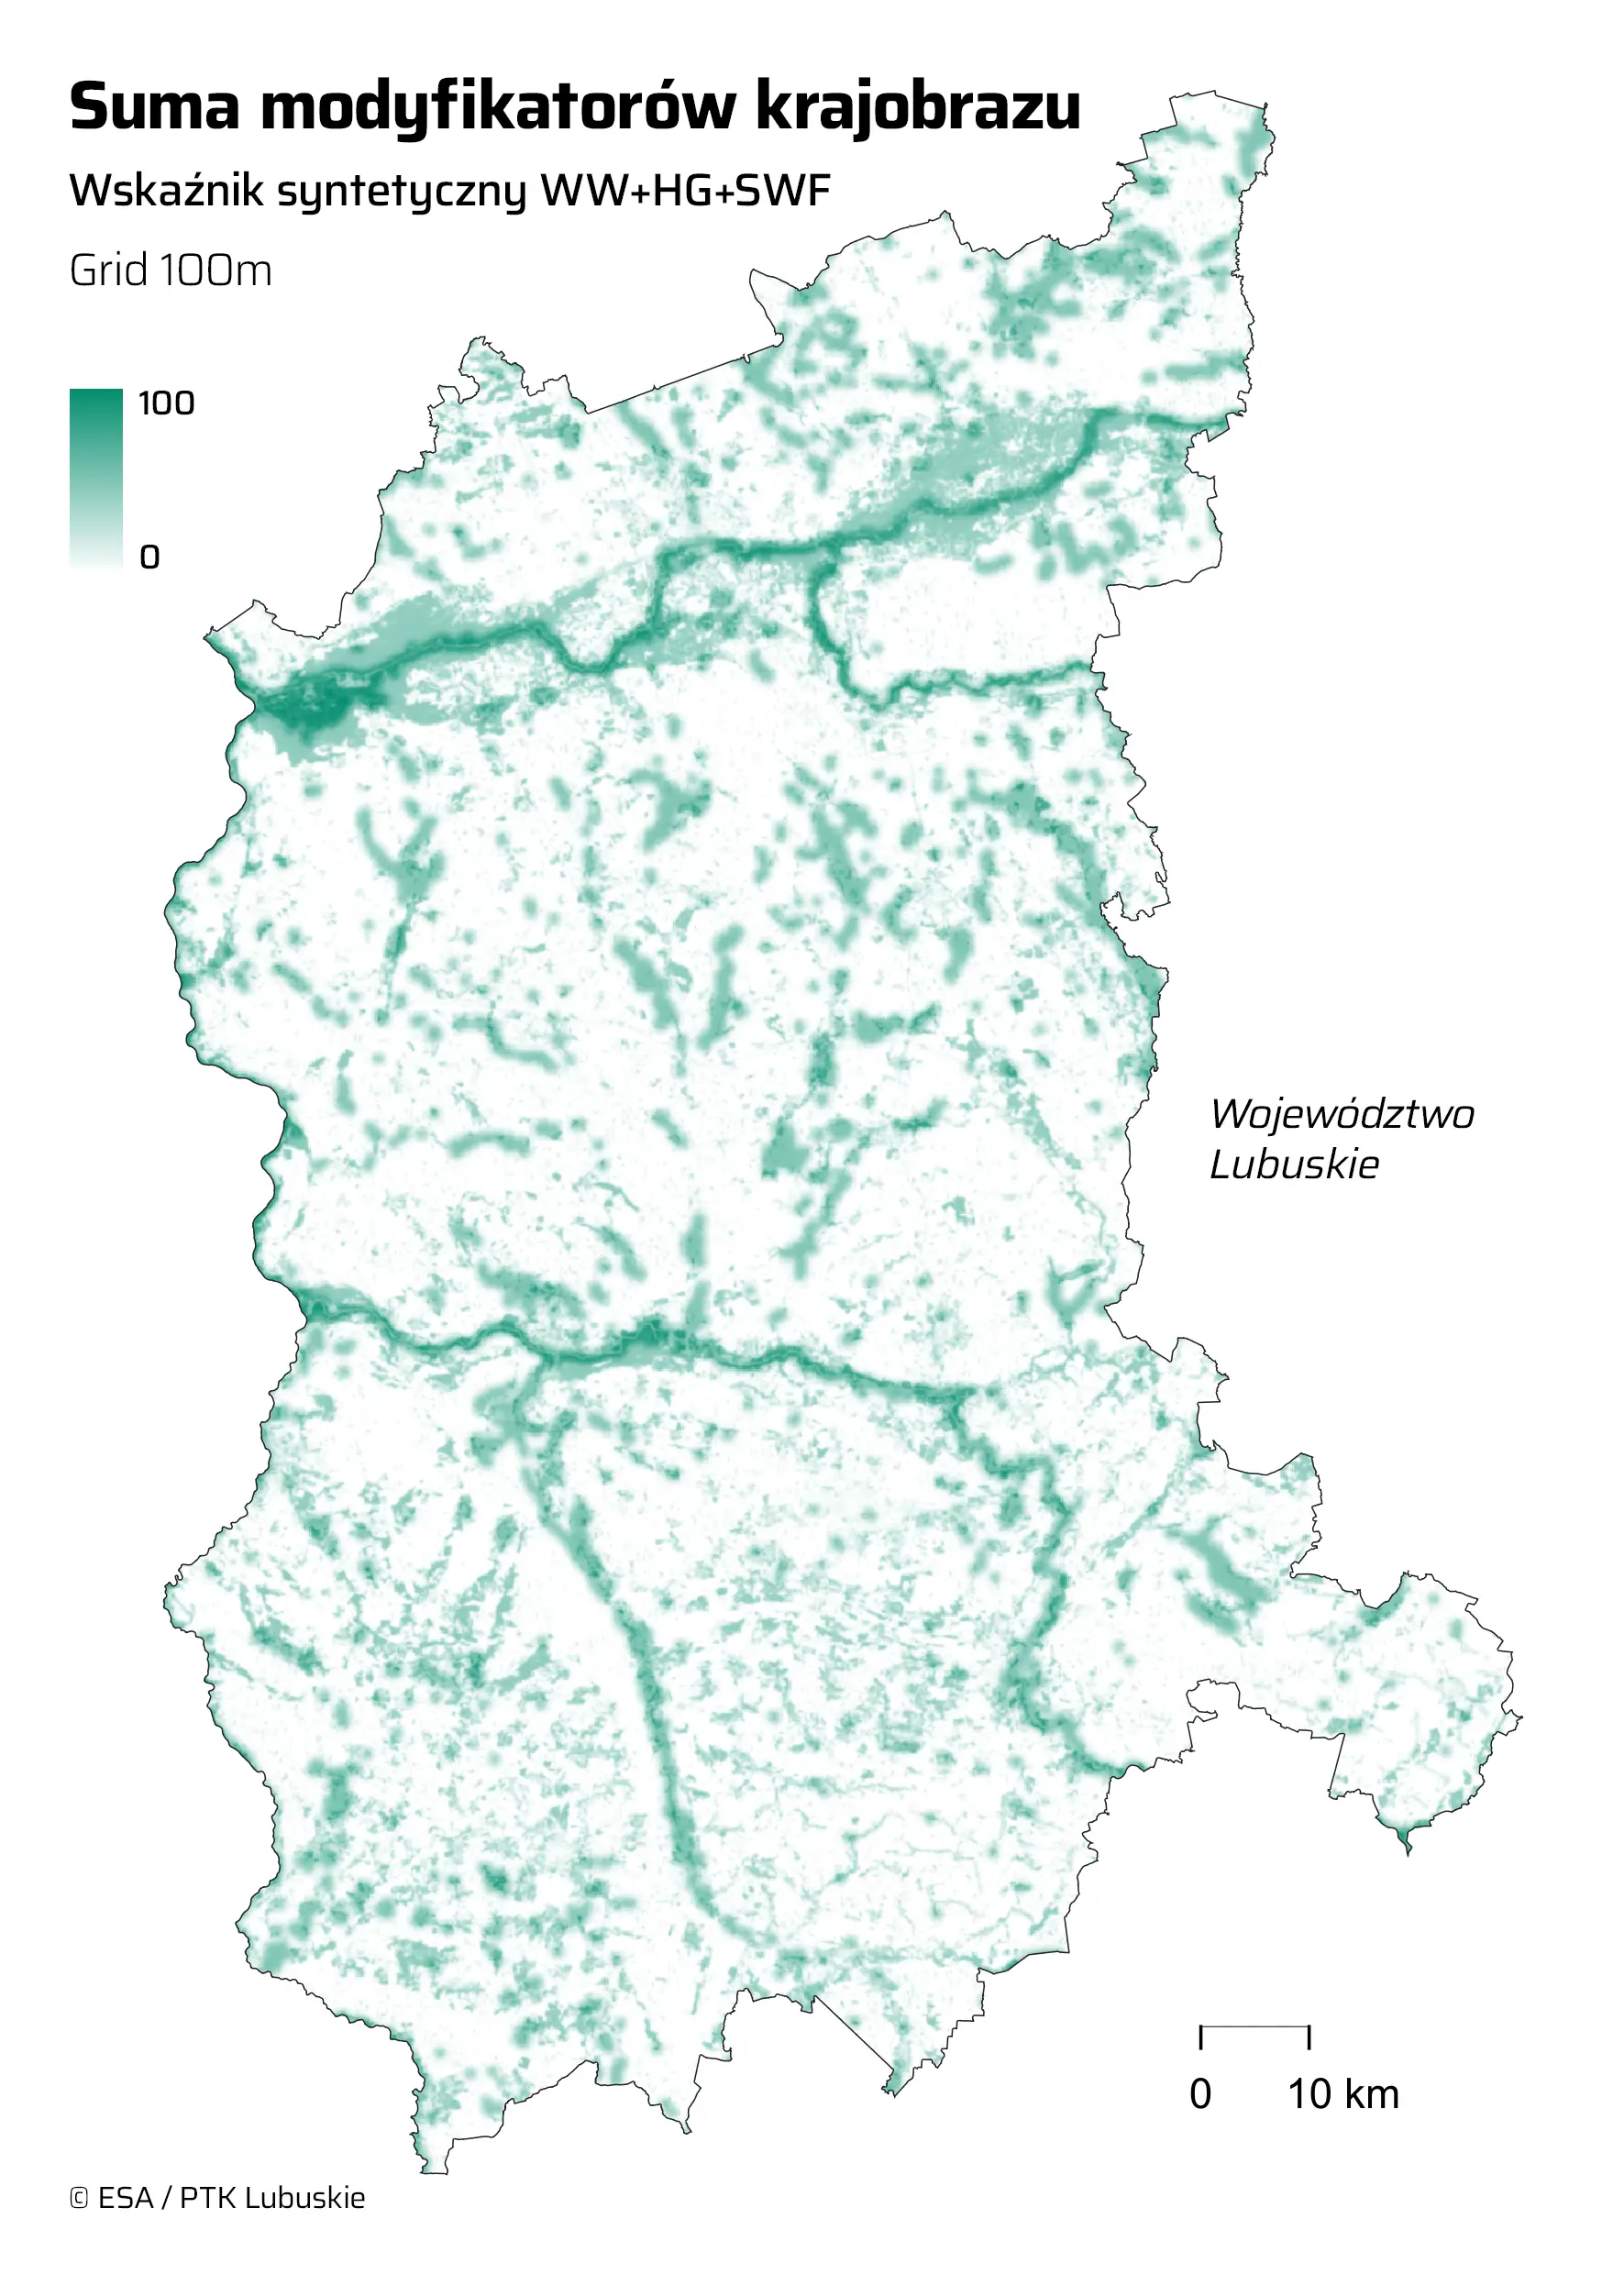
Fig. 6. Selected landscape-modifying features of the Lubuskie Voivodeship and their index. Source: PTK Lubuskie
3.2.5. Natural Attractiveness Index
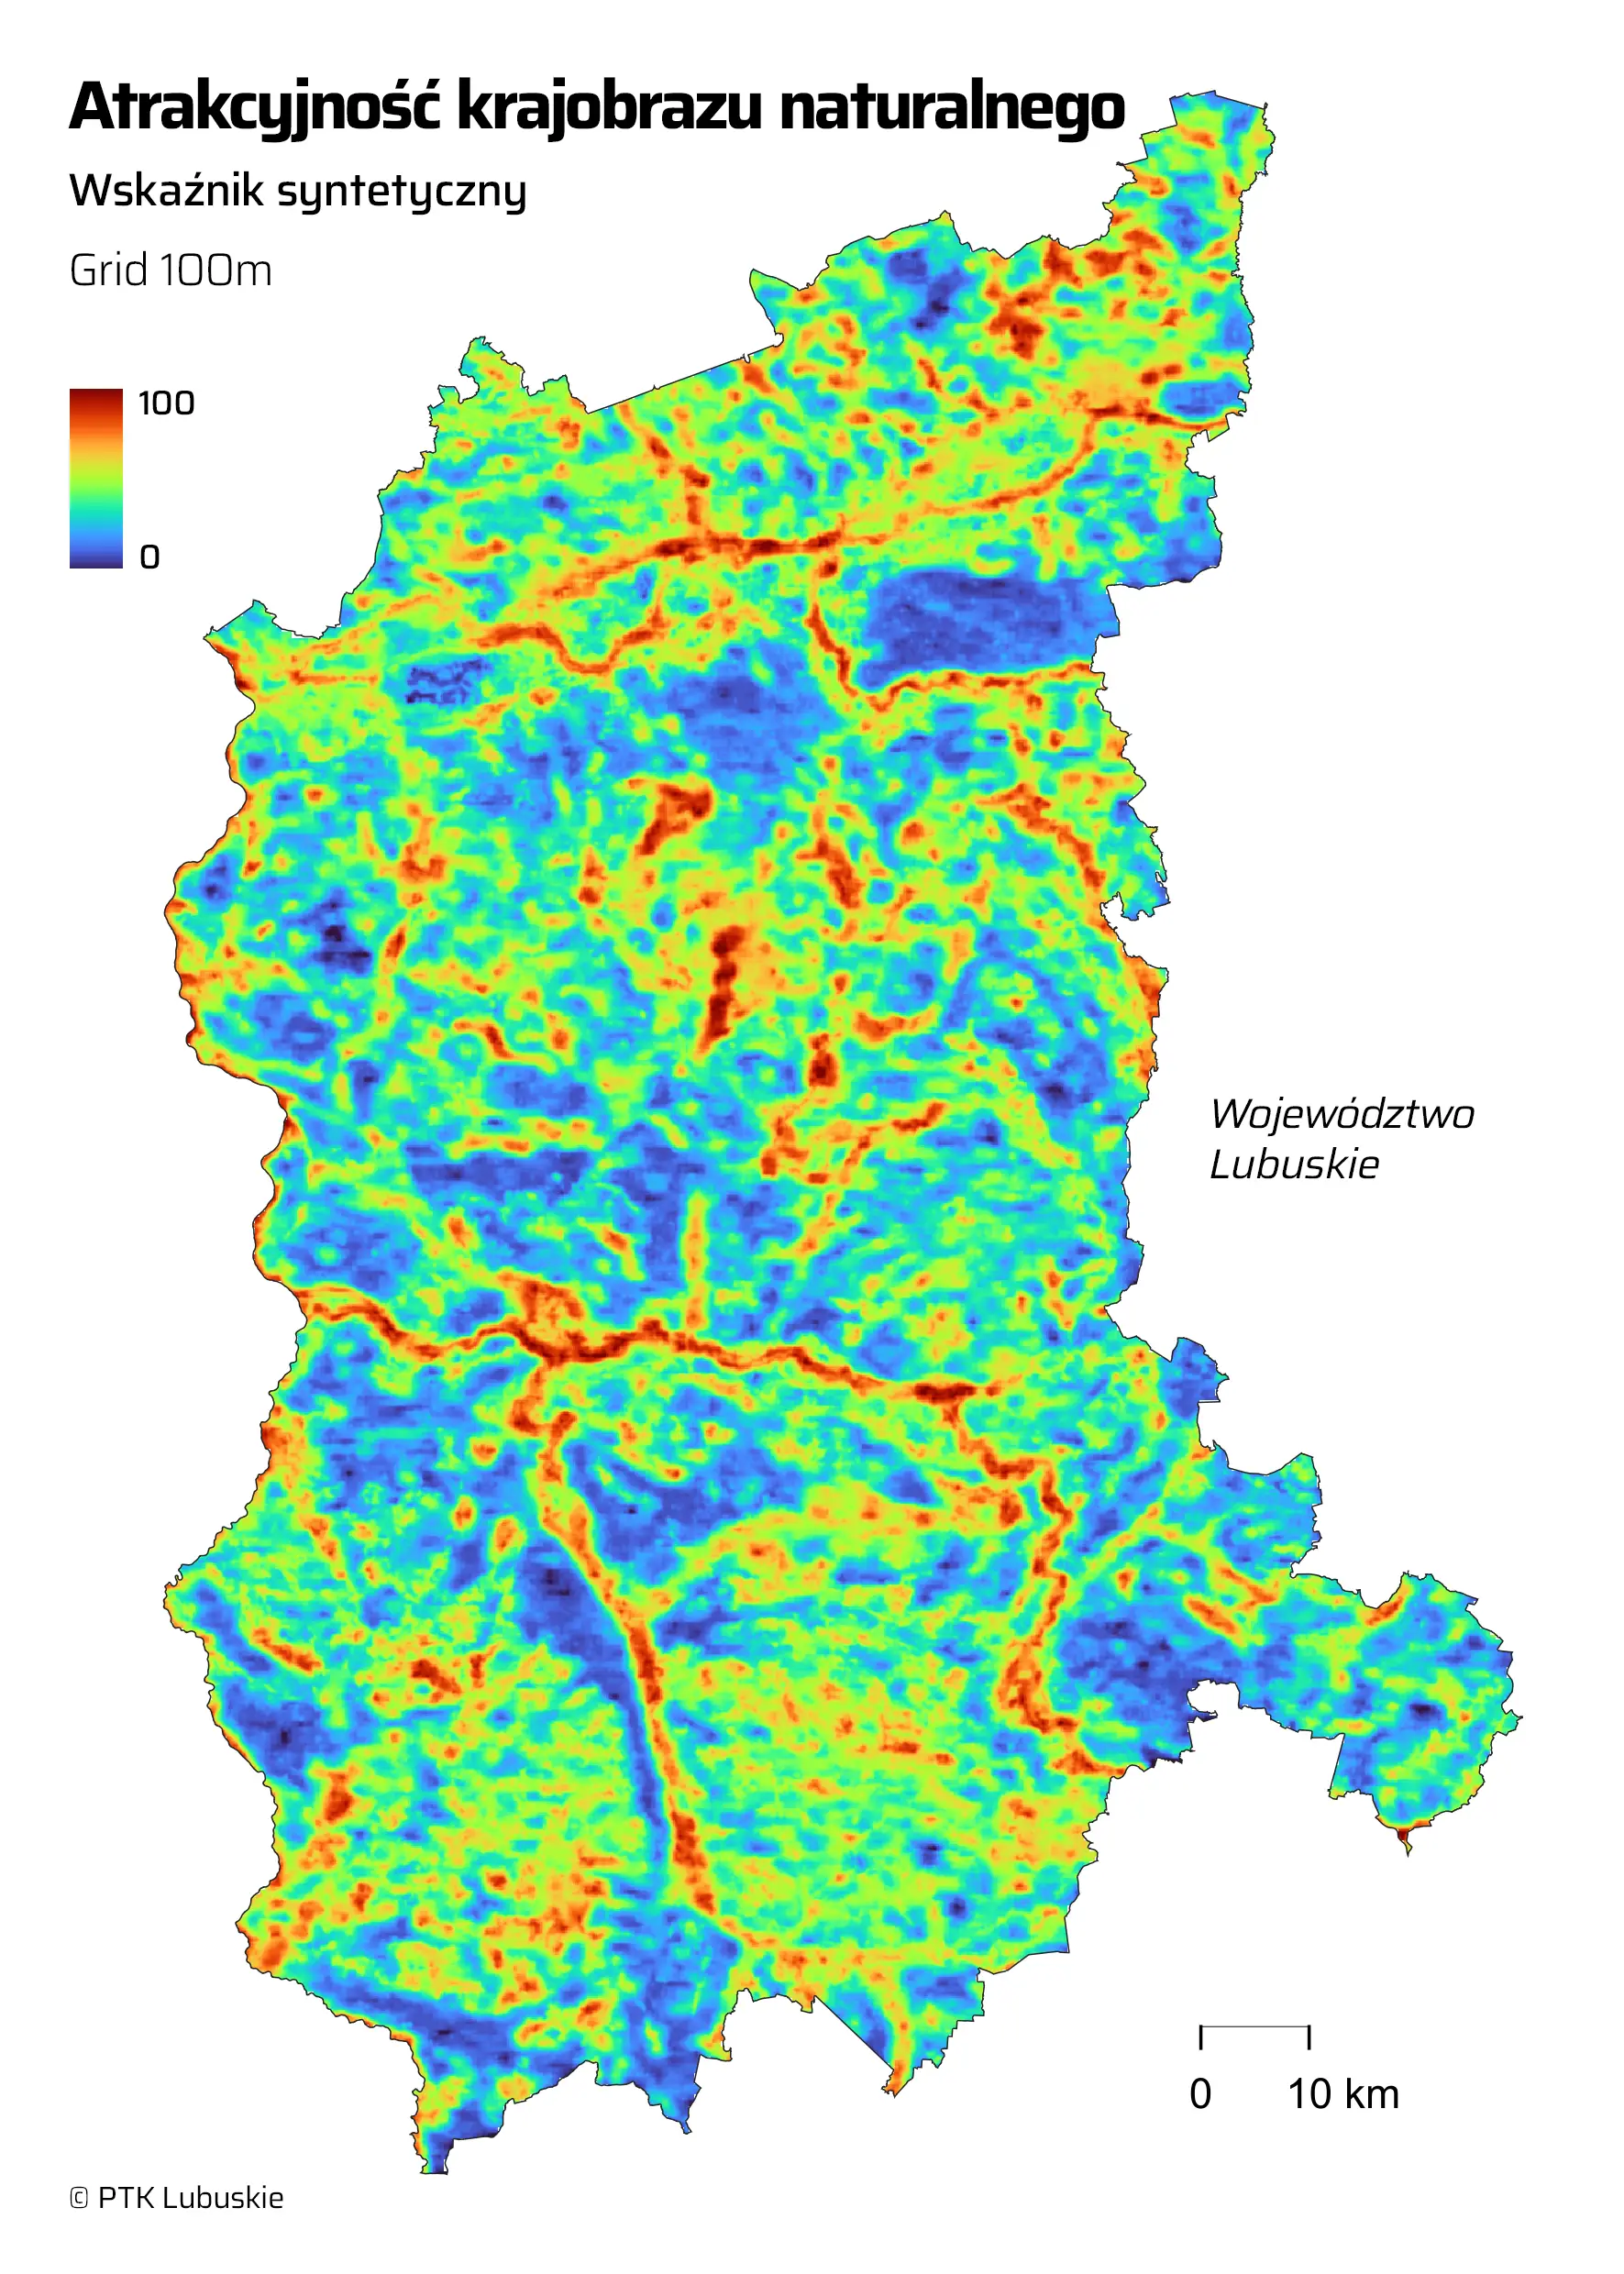
Using the resulting sets of LC/LF/F/M component layers, a composite index of the landscape’s natural attractiveness was constructed. Since the boundary of the attractiveness thus defined is also considered to be fuzzy, the resulting image was subjected to Gaussian filtering with a 3×3 window.
This is the most significant finding of the research carried out under this topic, and it also serves as a relative, unweighted measure of ecosystem services.
Fig. 7. Natural landscape attractiveness index for the Lubuskie Voivodeship. Source: PTK Lubuskie
3.2.5. Cultural sites and heritage (C)
In the next stage of the processing, cultural attractiveness layer C will be added, creating the final, cumulative attractiveness index.
The geodata used in this component is largely derived from resources made available as part of the 2024 Landscape Audit of the Lubuskie Voivodeship. A comprehensive set of thematic vector layers has enabled the effective incorporation of their features into algorithms for assessing landscape attractiveness.
The following GIS resources were selected to highlight the appeal of the ‘cultural layer’ of the Lubuskie Voivodeship’s landscape:
- monuments,
- UNESCO sites,
- cultural parks,
- nature reserves,
- local architectural styles,
- vineyards (>1 ha).
All of these take the form of vector layers with polygonal geometry; therefore, it is necessary to convert them into a raster format suitable for use in a raster data processing model. The methodology here is, however, relatively straightforward. Objects from all thematic layers were merged into a single composite vector layer (100 m resolution), ignoring their attributes. A buffer of 100 m was then applied to it, after which it was rasterised with a pixel value of 100 and subjected to Gaussian filtering with a 5×5 window.
Despite the availability of data, national and landscape parks were not included in the set of criteria. Their boundaries are directly determined by the environmental characteristics of the area; therefore, in the context of these analyses, they serve as a redundant reinforcement of the characteristics already included, and this applies to relatively large areas. This is also significant in terms of determining diversity, as a constant value over a large area will reduce that diversity.
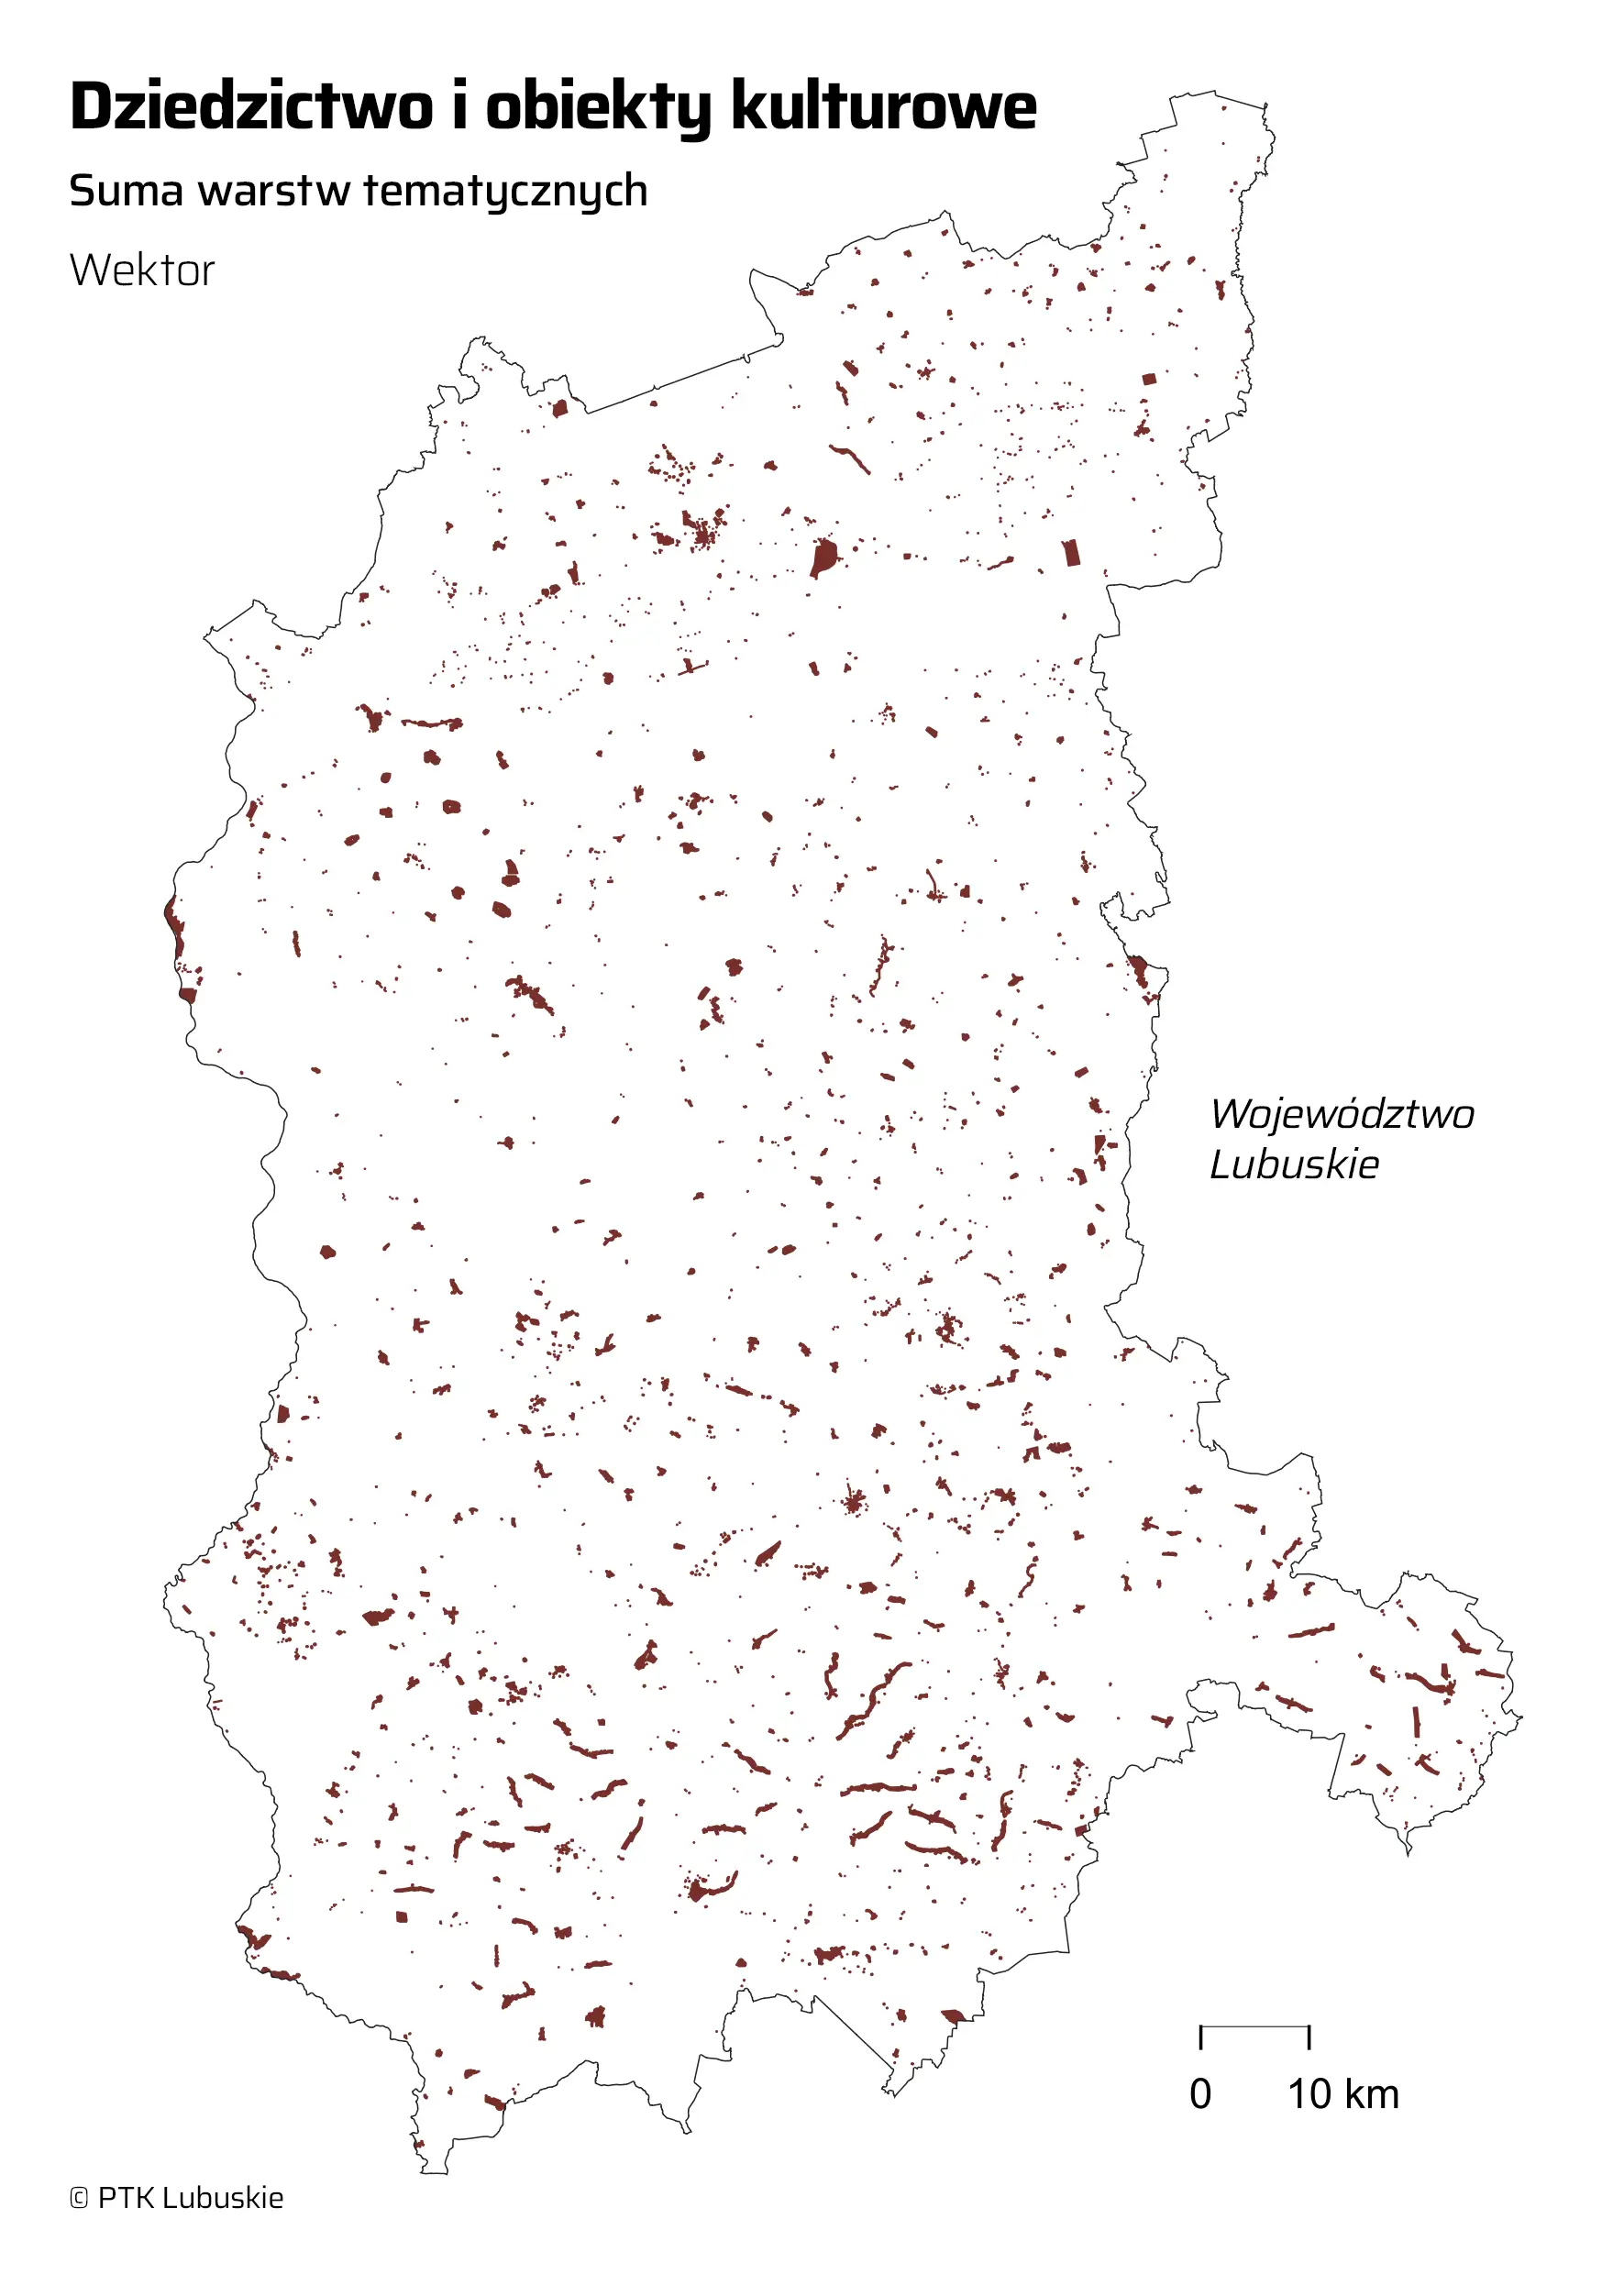
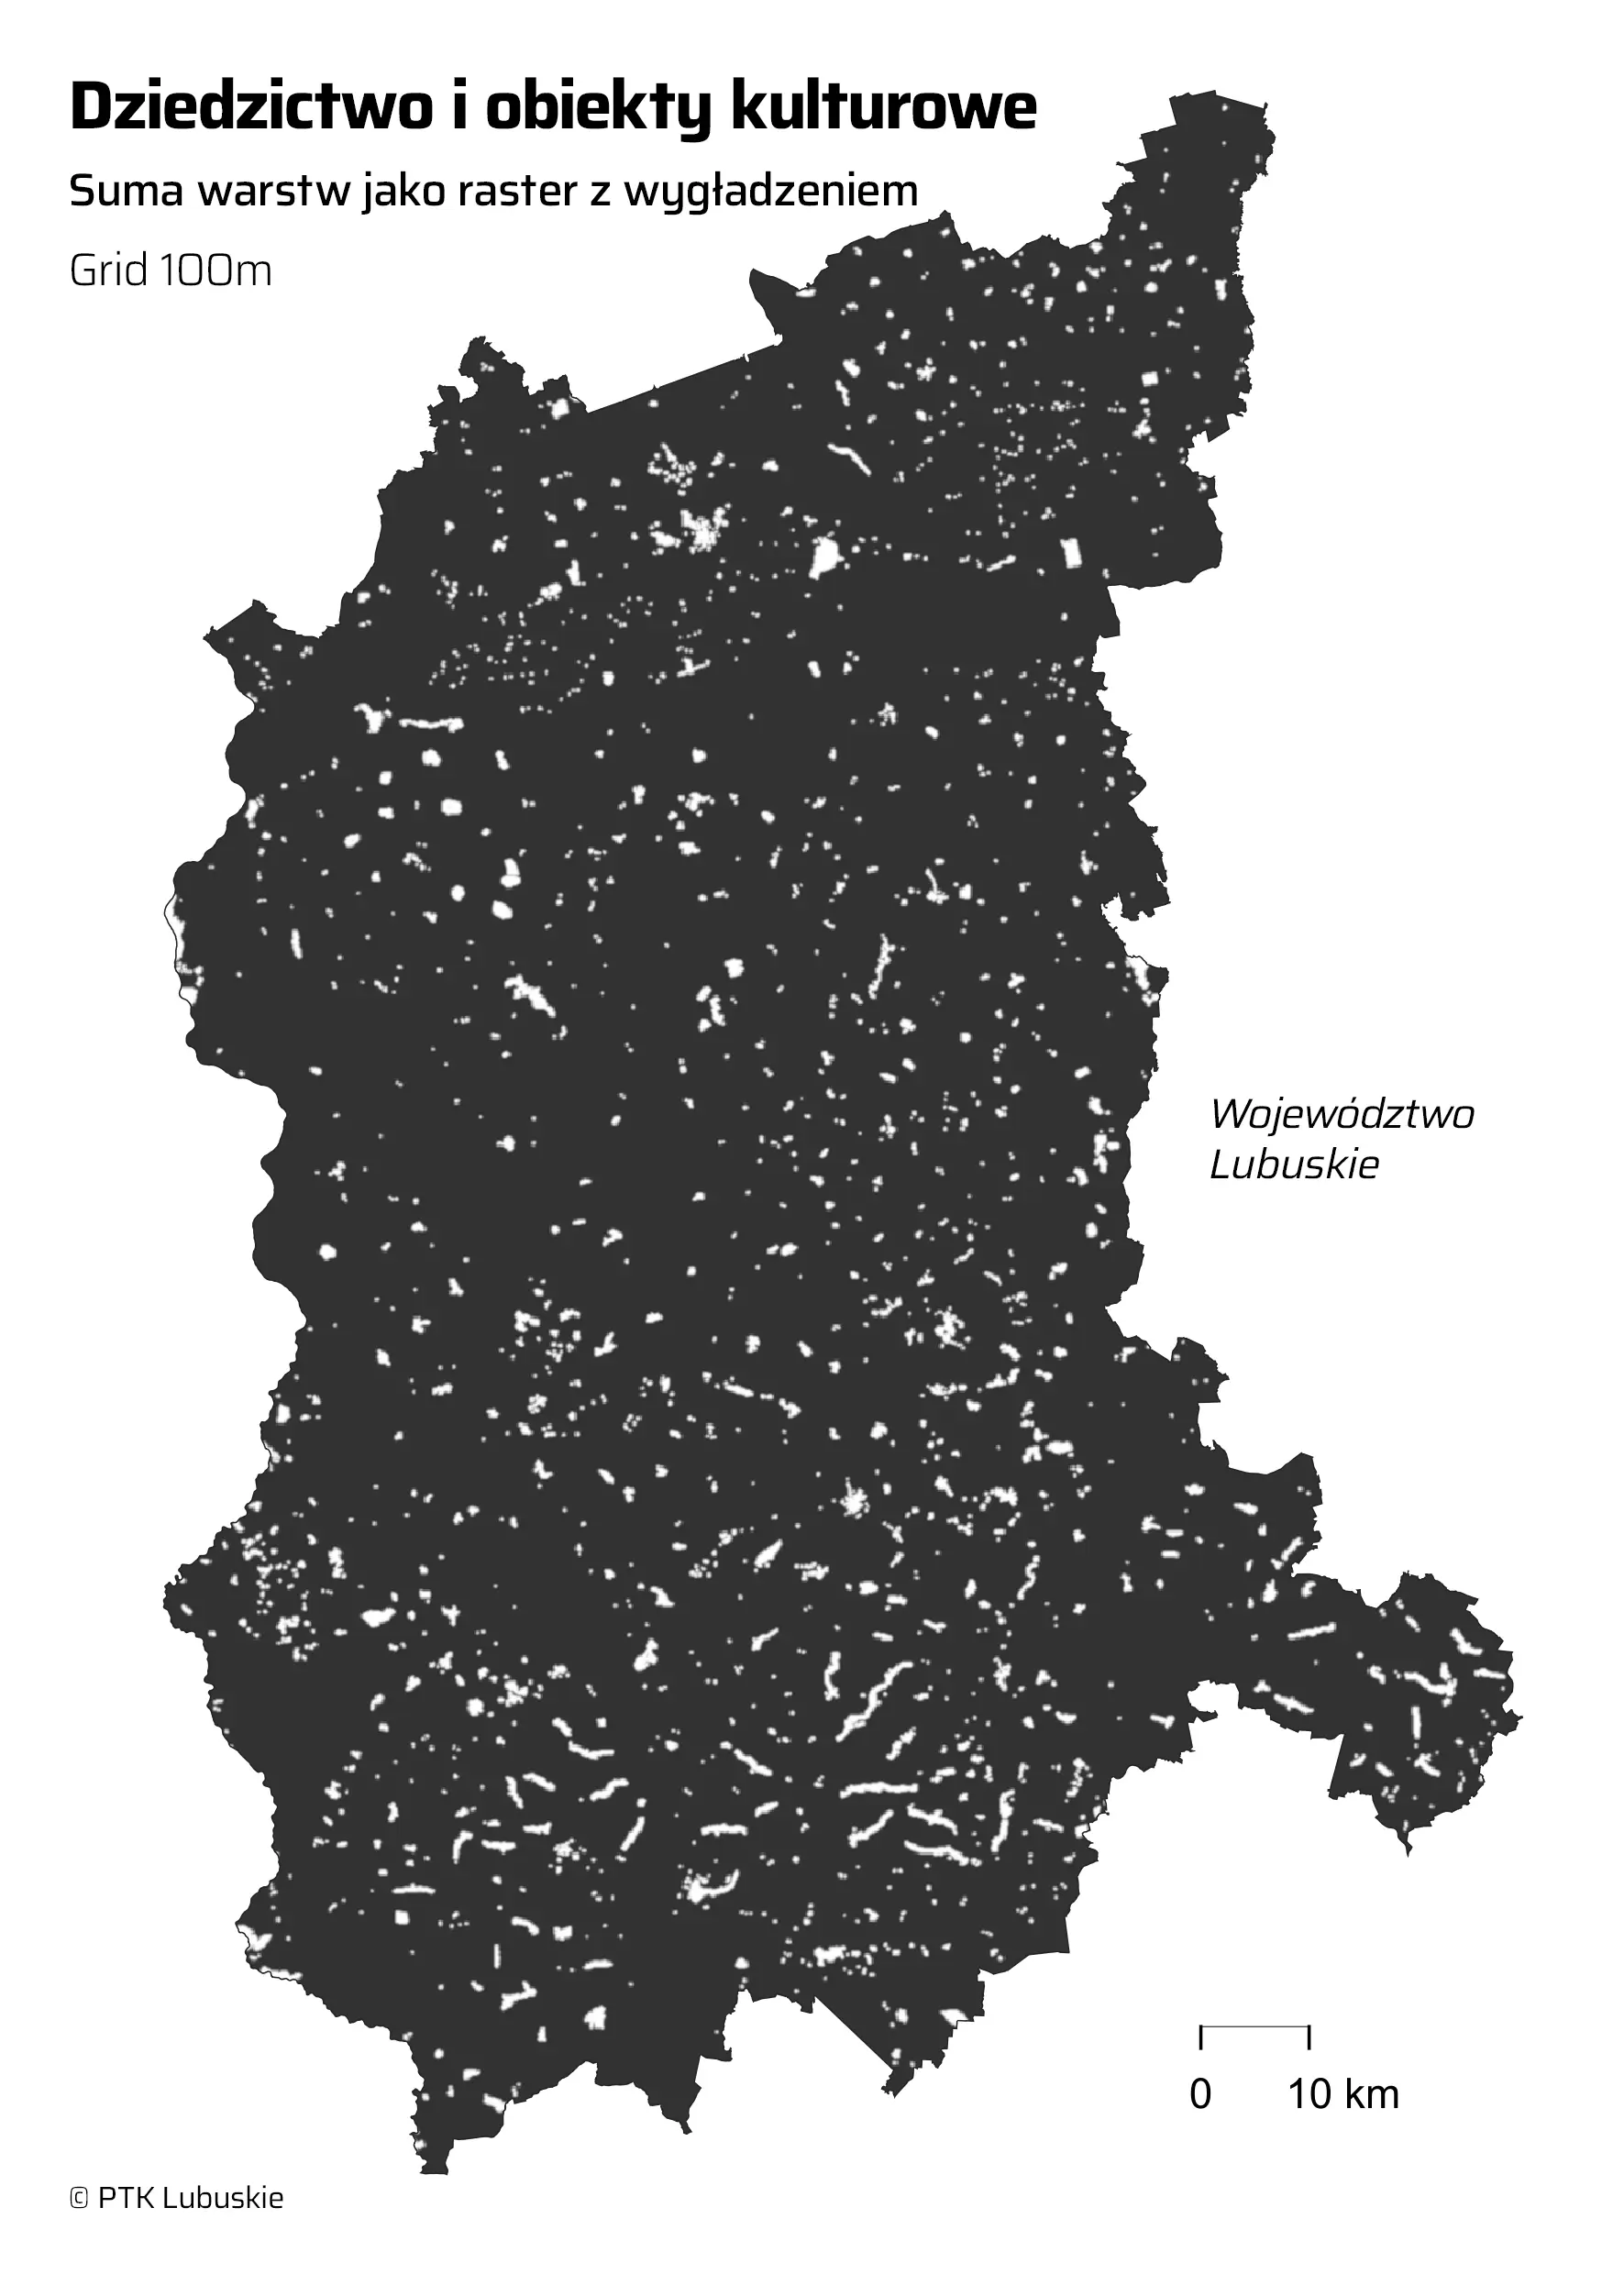
Fig. 8. Cultural and heritage sites in the Lubuskie Voivodeship and their index. Source: PTK Lubuskie
We publish the overall natural and cultural attractiveness index for the Lubuskie Voivodeship on the project’s map service.
4. Results
It is difficult to verify unequivocally the accuracy of the resulting maps for such a subjective issue. Members of the EO-BALP team who are from the Lubuskie Voivodeship and know the region well, as well as local experts consulted for their opinion, confirm that the indicators obtained are highly consistent with reality. We invite you to form your own opinion using the project’s map application linked below.
A useful way of verifying the results is to compare the continuous attractiveness index map with the map of Landscape Unit boundaries. To provide a more comprehensive picture, the average value was calculated for each Landscape Unit. Although the two spatial datasets were obtained in completely different ways and at different times, the spatial correlation between them is very clear. The ‘islands’ of attractiveness identified using the method described above and presented on the heat map largely coincide with the boundaries of the Landscape Units. Statistical summaries for the municipalities have also been compiled.
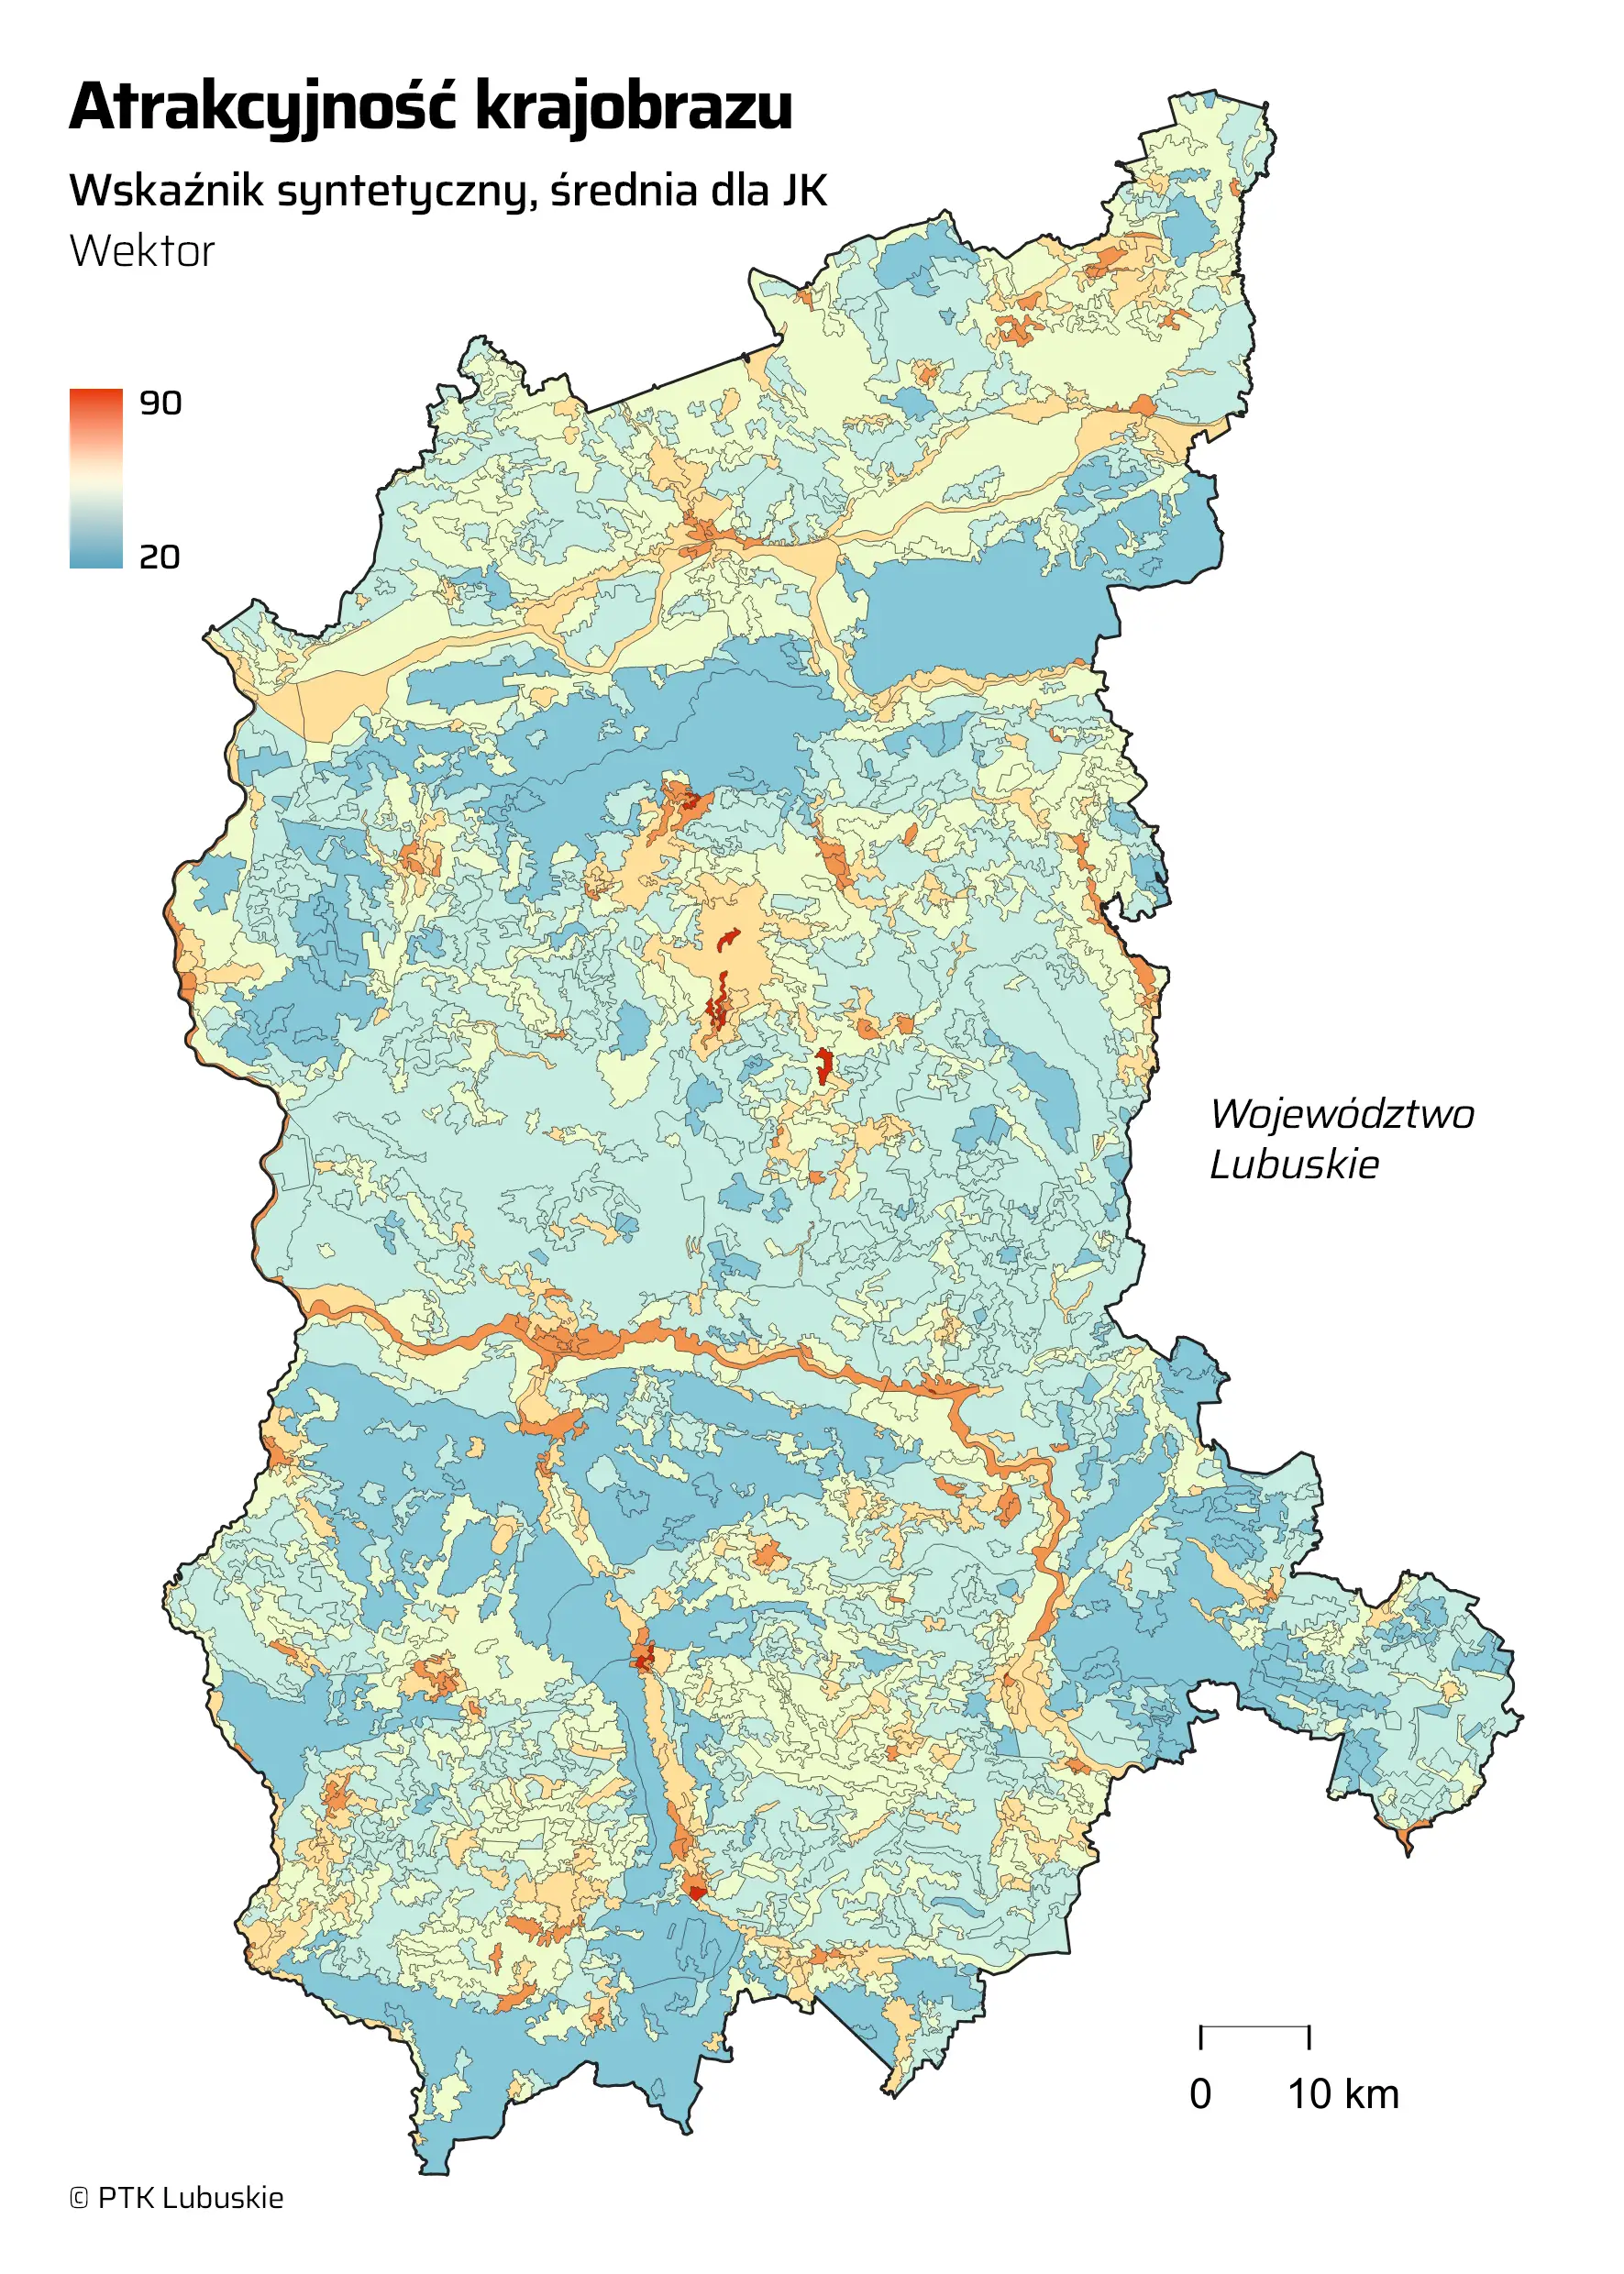
Fig. 8. Natural landscape attractiveness index for the Lubuskie Voivodeship and its correlation with Landscape Units. Source: PTK Lubuskie
The outcome of the research carried out as part of this project is a set of thematic geospatial data published in the form of an online map application. There, we present all the calculated indicator maps in a continuous format, as well as broken down by municipalities and landscape units.
Bibliography
Bartkowski, T. (1974). Applications of Physical Geography. PWN, Warsaw-Poznań.
Chmielewski T. J., Myga-Piątek U., Solon J. (2015). A typology of contemporary landscapes in Poland. Przegląd Geograficzny, 87, 3, pp. 377–408. http://dx.doi.org/10.7163/PrzG.2015.3.0
Duff, D., & Guesgen, H. W. (2002). An Evaluation of Buffering Algorithms in Fuzzy GISs. GIScience 2002, LNCS 2478, pp. 80–92.
Erikstad, Lars & Uttakleiv, Lars Andre & Halvorsen, Rune. (2015). Characterisation and mapping of landscape types: a case study from Norway. Belgeo. https://doi.org/10.4000/belgeo.17412.
EUROPEAN LANDSCAPE CONVENTION (2000). Journal of Laws of the Republic of Poland No. 14, Item 98, p. 564.
Jakiel M. (2015). An assessment of the visual attractiveness of the Kraków valleys – potential applications in spatial planning. Contemporary Issues and Research Trends in Geography, vol. 3, Institute of Geography and Spatial Planning, Jagiellonian University, Kraków, pp. 91–107 (link).
Mapping landscape attractiveness: A GIS-based landscape appreciation model for the Dutch countryside. (2011). Research in Urbanism Series, 2, 147–161. https://doi.org/10.7480/rius.2.210.
Mobaied, S., Geoffroy, J. and Machon, N. (2016). The Importance of Spatiotemporal Heterogeneity for Biodiversity in Forest–Heathland Mosaics and Implications for Heathland Conservation. Journal of Environmental Protection, 7, 1317–1332. doi: 10.4236/jep.2016.710115.
Ratajski, S., and Ziółkowski, M., eds. (2015). The Cultural and Natural Landscape from a Social Perspective. Polish National Commission for UNESCO, National Centre for Culture. ISBN 978-83-902939-9-8.
Simensen T., Halvorsen R., Erikstad L. (2018). Methods for landscape characterisation and mapping: A systematic review. Land Use Policy, Volume 75, June, pp. 557–569 https://doi.org/10.1016/j.landusepol.2018.04.022.
Sowińska-Świerkosz, B., & Michalik-Śnieżek, M. (2020). The Methodology of Landscape Quality (LQ) Indicators Analysis Based on Remote Sensing Data: A Case Study of Polish National Parks. Sustainability, 12(7), 2810. https://doi.org/10.3390/su12072810.
Vannoppen, A., Degerickx, J., & Gobin, A. (2021). Evaluating Landscape Attractiveness with Geospatial Data: A Case Study in Flanders, Belgium. Land, 10(7), 703. https://doi.org/10.3390/land10070703.